
Level:
Correct: 0
Incorrect: 0
Marks: 0/0
Exam Practice
Subject:
Topics:
AQA GCSE Chemistry Smart practice A mixed round aimed at your weak spots
Unit 1
Atomic structure and the periodic table
Unit 2
Bonding, structure, and the properties of matter
Unit 3
Quantitative chemistry
Unit 4
Chemical changes
Unit 5
Energy changes
Unit 6
The rate and extent of chemical change
Unit 7
Organic chemistry
Unit 8
Chemical analysis
Unit 9
Chemistry of the atmosphere
Unit 10
Using resources
Avg
score:
–
Topics
done:
0/124

Chemical measurements

Practise 14 exam-style questions on Chemical measurements for AQA GCSE Chemistry. Write your answer as you would in the exam and get it marked in seconds against the mark scheme, point by point, with an AI tutor on hand if you get stuck.

  • 14 questions
  • 1–5 marks each
  • Instant marking
  • No sign-up needed
14 questions, marked as you go

Sample questions with model answers

Here are 4 of the questions in this topic, each with a model answer, an explanation of why it earns the marks and the mark scheme an examiner would use.

Question 1

2 marks

A student measured the temperature rise when a metal was added to copper sulfate solution. The experiment was repeated four times. The temperature rises were:

6.2 °C, 6.4 °C, 8.9 °C, 6.3 °C

Identify the anomalous result and calculate the mean temperature rise.

Model answer

The anomalous result is 8.9 °C.
Mean = (6.2 + 6.4 + 6.3) ÷ 3 = 6.3 °C

Explanation

An anomalous result does not fit the pattern of the others and is left out when the mean is calculated. Including it would give 6.95 °C, which does not represent the other three results.

Mark scheme
  1. 1 mark

    8.9 °C is anomalous

    correct answer with no working scores full marks

  2. 1 mark

    mean = (6.2 + 6.4 + 6.3) ÷ 3 = 6.3 °C

    do not accept 6.95 (anomalous result included)
Question 2

2 marks

Explain why scientists repeat measurements and calculate a mean.

Model answer

Repeating measurements and calculating a mean reduces the effect of random errors, so the mean is likely to be closer to the true value. Repeats also make it possible to spot anomalous results and to use the range to estimate the uncertainty.

Explanation

A single measurement could be affected by a random error and you would not know. Several repeats show how much the results vary, reveal anomalies and give a more trustworthy mean. Repeating does not make a test 'fair' - that is about controlling variables.

Mark scheme
  1. 1 mark

    to reduce the effect of random errors

    max 2; allow the mean is closer to the true value

  2. 1 mark

    so that anomalous results can be identified (and left out)

  3. 1 mark

    to show the results are repeatable / to find the spread (range) and so the uncertainty

    ignore 'to make it a fair test'

Question 3

3 marks

A student timed how long it took for a cross to disappear in a reaction. The experiment was repeated five times. The times were:

45 s, 48 s, 42 s, 49 s, 46 s

Calculate the mean time and the uncertainty. Write the result in the form: mean ± uncertainty.

Model answer

Mean = (45 + 48 + 42 + 49 + 46) ÷ 5 = 230 ÷ 5 = 46 s
Range = 49 - 42 = 7 s
Uncertainty = 7 ÷ 2 = 3.5 s
Result: 46 ± 3.5 s

Explanation

The uncertainty is half the range of the results, placed either side of the mean. A common mistake is to give the whole range (± 7 s) as the uncertainty, which doubles it.

Mark scheme
  1. 1 mark

    mean = 230 ÷ 5 = 46 (s)

    correct answer with no working scores full marks

  2. 1 mark

    range = 49 - 42 = 7 (s)

  3. 1 mark

    46 ± 3.5 s

    allow ecf from mean and range; uncertainty = range ÷ 2

Question 4

4 marks

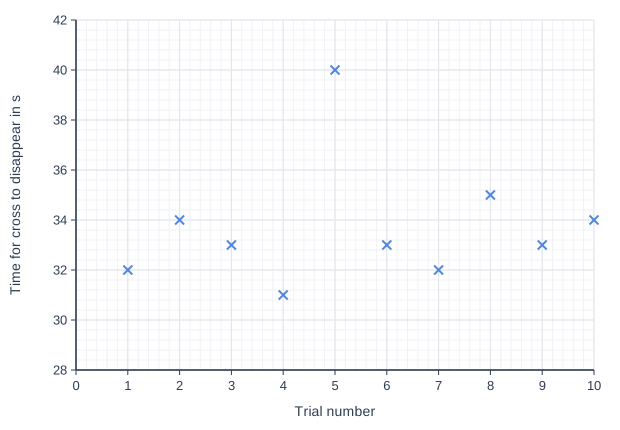
A student measured the time for a cross to disappear ten times under the same conditions. The graph shows the results.

Use the graph to identify the anomalous result. Then calculate the mean of the other results and give the result in the form: mean ± uncertainty.

Line graph of time for cross to disappear in s (y-axis, 28 to 42) against trial number (x-axis, 0 to 10). The line joins the points (1, 32), (2, 34), (3, 33), (4, 31), (5, 40), (6, 33), (7, 32), (8, 35), (9, 33), (10, 34).

Model answer

Trial 5 (40 s) is anomalous.
The other results are 32, 34, 33, 31, 33, 32, 35, 33 and 34 s.
Mean = 297 ÷ 9 = 33 s
Range = 35 - 31 = 4 s, so uncertainty = ± 2 s
Result: 33 ± 2 s

Explanation

Plotting all repeat results shows their distribution: most cluster between 31 and 35 s, so the point at 40 s stands out as anomalous. Leave it out, then use half the range of the remaining results as the uncertainty.

Mark scheme
  1. 1 mark

    trial 5 / 40 s is anomalous

    correct answer with no working scores full marks

  2. 1 mark

    mean of the other nine results = 297 ÷ 9 = 33 (s)

    do not accept 33.7 (anomalous result included)

  3. 1 mark

    range = 35 - 31 = 4 (s)

  4. 1 mark

    33 ± 2 s

    allow ecf from mean and range

Ready to try the rest? Every answer you write is marked against the mark scheme, so you can see exactly where the marks are.

AI Tutor Hints first, answers after you try

Hi! Stuck? Ask me for a hint and I’ll help you work it out. Once you’ve checked your answer I can explain exactly where the marks are.