
Level:
Correct: 0
Incorrect: 0
Marks: 0/0
Exam Practice
Subject:
Topics:
AQA GCSE Physics Smart practice A mixed round aimed at your weak spots
Unit 1
Energy
Energy changes in a system, and the ways energy is stored before and after such changes
Energy stores and systems
0%
Changes in energy
0%
Energy changes in systems
0%
Power
0%
Conservation and dissipation of energy
Energy transfers in a system
0%
Efficiency
0%
Unit 2
Electricity
Unit 3
Particle model of matter
Unit 4
Atomic structure
Unit 5
Forces
Unit 6
Waves
Unit 7
Magnetism and electromagnetism
Unit 8
Space physics (physics only)
Avg
score:
–
Topics
done:
0/91

The distance\\\\u2013time relationship

Practise 28 exam-style questions on The distance\\\\u2013time relationship for AQA GCSE Physics. Write your answer as you would in the exam and get it marked in seconds against the mark scheme, point by point, with an AI tutor on hand if you get stuck.

  • 28 questions
  • 1–6 marks each
  • Instant marking
  • No sign-up needed
20 questions, marked as you go

Sample questions with model answers

Here are 4 of the questions in this topic, each with a model answer, an explanation of why it earns the marks and the mark scheme an examiner would use.

Question 1

2 marks

A student is going to make a distance–time graph from her results.

State which quantity should go on the horizontal (x) axis. Give a reason for your answer.

Model answer

Time should go on the horizontal axis, because it is the independent variable; the distance depends on the time.

Explanation

By convention the independent variable goes on the x-axis and the dependent variable on the y-axis. Plotting distance on the y-axis also means the gradient equals the speed.

Mark scheme
  1. 1 mark

    time

  2. 1 mark

    time is the independent variable (the variable she chooses when to measure)

    allow distance depends on time
Question 2

2 marks

Describe how the distance–time graph for an object moving at a constant speed is different from the distance–time graph for an object that is speeding up.

Model answer

For constant speed the graph is a straight sloping line with a constant gradient. For an object speeding up the graph is a curve that gets steeper, because the gradient (the speed) is increasing.

Explanation

The shape of a distance–time graph shows how the speed changes. Straight line: constant speed; steepening curve: speeding up; flattening curve: slowing down; horizontal line: stationary.

Mark scheme
  1. 1 mark

    constant speed: a straight (sloping) line

    allow constant gradient

  2. 1 mark

    speeding up: a curve that gets steeper (increasing gradient)

    'curve' alone is not enough

Question 3

3 marks

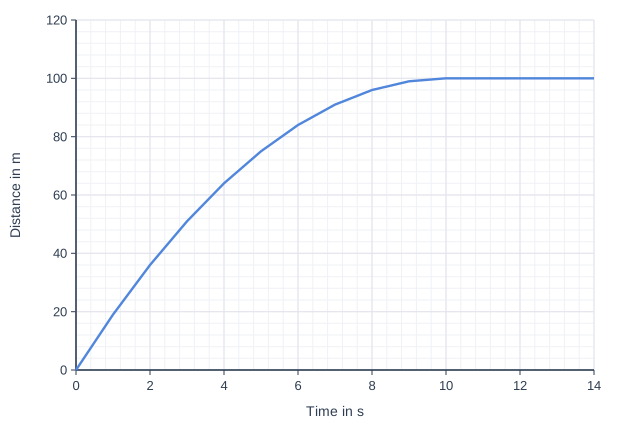
The graph shows how the distance travelled by a car changes as it approaches a set of traffic lights.

Describe the motion of the car during the 14 s shown. Give reasons for your answer.

Line graph of distance in m (y-axis, 0 to 120) against time in s (x-axis, 0 to 14). The line joins the points (0, 0), (1, 19), (2, 36), (3, 51), (4, 64), (5, 75), (6, 84), (7, 91), (8, 96), (9, 99), (10, 100), (14, 100).

Model answer

From 0 to 10 s the car is slowing down (decelerating), because the curve gets less steep, so its gradient (the speed) is decreasing. At 10 s the gradient becomes zero, and from 10 s to 14 s the line is horizontal, so the car is stationary at the lights.

Explanation

A curve that becomes less steep shows decreasing speed; when it becomes horizontal the speed is zero. The car travels 100 m while braking before it stops.

Mark scheme
  1. 1 mark

    0 to 10 s: the car is slowing down / decelerating

  2. 1 mark

    because the gradient decreases / the curve gets less steep

  3. 1 mark

    10 s to 14 s: the car is stationary (stopped at the lights) because the line is horizontal

Question 4

4 marks

Two trains leave the same station at the same time and travel along straight, parallel tracks in the same direction. Train P travels at a constant speed of 40 m/s and train Q at a constant speed of 25 m/s.

Describe how the distance–time graphs for the two trains would differ, and calculate how far apart the trains are after 2.0 minutes.

Model answer

Both graphs are straight lines starting at the origin, because both trains move at constant speeds from the same place. Train P's line is steeper because it is faster.
2.0 minutes = 120 s
Train P: s = 40 × 120 = 4800 m
Train Q: s = 25 × 120 = 3000 m
Distance apart = 4800 − 3000 = 1800 m

Explanation

On a distance–time graph the gap between the two lines at a given time shows how far apart the objects are, and it grows steadily because the speeds are constant. The time must be in seconds to use speeds in m/s.

Mark scheme
  1. 1 mark

    both graphs are straight lines from the origin, but the line for train P is steeper

    allow P has a greater gradient; correct answer with no working scores full marks

  2. 1 mark

    distance for P = 40 × 120 = 4800 (m)

    time in s needed

  3. 1 mark

    distance for Q = 25 × 120 = 3000 (m)

  4. 1 mark

    the trains are 1800 m apart

    allow (40 − 25) × 120 = 1800 m for the last three marks; allow ecf

Ready to try the rest? Every answer you write is marked against the mark scheme, so you can see exactly where the marks are.

AI Tutor Hints first, answers after you try

Hi! Stuck? Ask me for a hint and I’ll help you work it out. Once you’ve checked your answer I can explain exactly where the marks are.