Level:
Correct: 0
Incorrect: 0
Marks: 0/0
Exam Practice
Subject:
Topics:
AQA GCSE Physics Smart practice A mixed round aimed at your weak spots
Unit 1
Energy
Energy changes in a system, and the ways energy is stored before and after such changes
Energy stores and systems
0%
Changes in energy
0%
Energy changes in systems
0%
Power
0%
Conservation and dissipation of energy
Energy transfers in a system
0%
Efficiency
0%
Unit 2
Electricity
Unit 3
Particle model of matter
Unit 4
Atomic structure
Unit 5
Forces
Unit 6
Waves
Unit 7
Magnetism and electromagnetism
Unit 8
Space physics (physics only)
Avg
score:
–
Topics
done:
0/91

Direct and alternating potential difference

Practise 19 exam-style questions on Direct and alternating potential difference for AQA GCSE Physics. Write your answer as you would in the exam and get it marked in seconds against the mark scheme, point by point, with an AI tutor on hand if you get stuck.

  • 19 questions
  • 1–6 marks each
  • Instant marking
  • No sign-up needed
19 questions, marked as you go

Sample questions with model answers

Here are 4 of the questions in this topic, each with a model answer, an explanation of why it earns the marks and the mark scheme an examiner would use.

Question 1

1 mark

What is meant by a direct current (d.c.)?

Model answer

A direct current is a current that always flows in the same direction.

Explanation

Cells and batteries provide a direct potential difference, so the current they produce always flows the same way round the circuit, from the positive terminal to the negative terminal (conventional current).

Mark scheme
  1. 1 mark

    a current that flows in one direction only

    allow a current that does not change direction
Question 2

2 marks

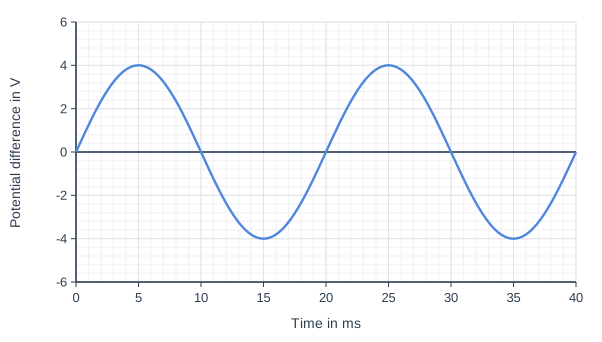
The graph shows how the potential difference of a supply changes with time.

Is the supply a.c. or d.c.? Give a reason for your answer.

Graph of potential difference in V (y-axis, -6 to 6) against time in ms (x-axis, 0 to 40), on a grid. A wave is drawn as a smooth, regular sine-shaped curve centred on the zero line: its crests reach 4 V and its troughs -4 V; it repeats every 20 ms (crests at time = 5 and 25 ms).

Model answer

The supply is a.c. The potential difference keeps changing from positive to negative and back again, so its direction keeps reversing.

Explanation

On a graph of potential difference against time, a negative value means the potential difference is in the opposite direction. A d.c. supply would stay on one side of the zero line.

Mark scheme
  1. 1 mark

    a.c.

    allow alternating

  2. 1 mark

    the potential difference changes between positive and negative values / reverses direction

    allow the graph goes above and below zero; do not accept 'it is a wave' on its own

Question 3

3 marks

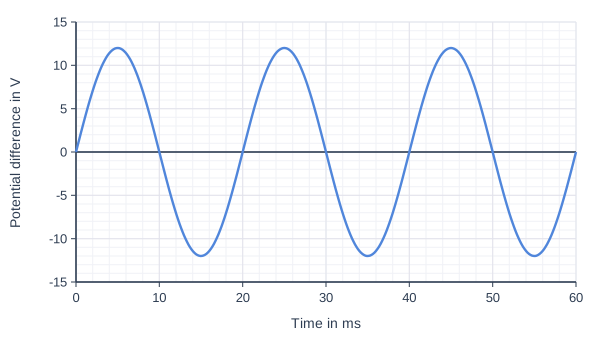
The graph shows the output of a low-voltage a.c. supply, displayed on an oscilloscope.

The equation linking period and frequency is:
period = 1 ÷ frequency

Show that the supply has the same frequency as the UK mains.

Graph of potential difference in V (y-axis, -15 to 15) against time in ms (x-axis, 0 to 60), on a grid. A wave is drawn as a smooth, regular sine-shaped curve centred on the zero line: its crests reach 12 V and its troughs -12 V.

Model answer

From the graph, one complete cycle takes 20 ms = 0.020 s.
f = 1 ÷ T = 1 ÷ 0.020 = 50 Hz
The UK mains frequency is also 50 Hz, so the frequencies are the same.

Explanation

Measure the period as the time for one complete cycle, for example from one crest to the next, and convert milliseconds to seconds before using f = 1 ÷ T. Measuring across several cycles and dividing gives a more accurate period.

Mark scheme
  1. 1 mark

    period read from the graph = 20 ms

    allow 0.020 s

  2. 1 mark

    f = 1 ÷ 0.020

    allow ecf from their period

  3. 1 mark

    f = 50 Hz, which is the same as the UK mains frequency

    comparison with 50 Hz needed

Question 4

4 marks

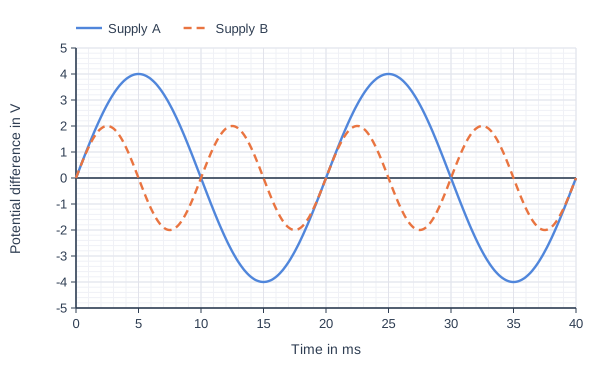
The graph shows how the potential differences of two a.c. supplies, A and B, vary with time.

The equation linking period and frequency is:
period = 1 ÷ frequency

Compare the peak potential difference and the frequency of supply A with those of supply B.

Graph of potential difference in V (y-axis, -5 to 5) against time in ms (x-axis, 0 to 40), on a grid. The wave "Supply A" is drawn as a smooth, regular sine-shaped curve centred on the zero line; its values can be read from the grid. The wave "Supply B" (dashed) is drawn as a smooth, regular sine-shaped curve centred on the zero line; its values can be read from the grid.

Model answer

Supply A has a peak potential difference of 4 V and supply B has a peak of 2 V, so B's peak is half of A's. One cycle of A takes 20 ms, so its frequency is 1 ÷ 0.020 = 50 Hz. One cycle of B takes 10 ms, so its frequency is 1 ÷ 0.010 = 100 Hz. B has twice the frequency of A.

Explanation

On a potential difference-time graph, the height of the crests gives the peak potential difference and the time for one cycle gives the period. A shorter period means a higher frequency: B completes two cycles in the time A completes one.

Mark scheme
  1. 1 mark

    peak p.d. of A = 4 V and of B = 2 V

  2. 1 mark

    B has half the peak p.d. of A

    allow A has twice the peak p.d. of B

  3. 1 mark

    period of A = 20 ms (50 Hz) and period of B = 10 ms (100 Hz)

    allow either the periods or the frequencies

  4. 1 mark

    B has twice the frequency of A

    allow A has half the frequency of B

Ready to try the rest? Every answer you write is marked against the mark scheme, so you can see exactly where the marks are.

AI Tutor Hints first, answers after you try

Hi! Stuck? Ask me for a hint and I’ll help you work it out. Once you’ve checked your answer I can explain exactly where the marks are.