
Level:
Correct: 0
Incorrect: 0
Marks: 0/0
Exam Practice
Course:
Topics:
OCR GCSE Maths (Higher calculator) Smart practice A mixed round aimed at your weak spots
Unit 1
Number Operations and Integers
Unit 2
Fractions, Decimals and Percentages
Unit 3
Indices and Surds
Unit 4
Approximation and Estimation
Unit 5
Ratio, Proportion and Rates of Change
Unit 6
Algebra
Unit 7
Graphs of Equations and Functions
Unit 8
Basic Geometry
Unit 9
Congruence and Similarity
Unit 10
Mensuration
Unit 11
Probability
Unit 12
Statistics
Avg
score:
–
Topics
done:
0/121

Scatter graphs, correlation and outliers

Practise 15 exam-style questions on Scatter graphs, correlation and outliers for OCR GCSE Maths (Higher calculator). Write your answer as you would in the exam and get it marked in seconds against the mark scheme, point by point, with the Study Helper on hand if you get stuck.

  • 15 questions
  • 1–4 marks each
  • Instant marking
  • No sign-up needed
15 questions, marked as you go

Sample questions with model answers

Here are 4 of the questions in this topic, each with a model answer, an explanation of why it earns the marks and the mark scheme an examiner would use.

Question 1

2 marks

The scatter graph shows the engine size and the fuel economy, in miles per gallon (mpg), of 13 cars.

Describe the correlation shown, and explain what it tells you about engine size and fuel economy.
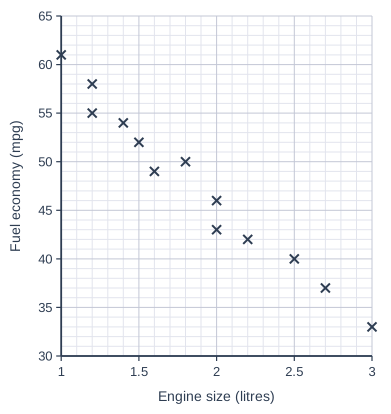
Scatter graph on a grid of small squares. The horizontal axis is "Engine size (litres)", from 1 to 3, numbered every 0.5, with 5 small squares between numbered values (each small square is 0.1). The vertical axis is "Fuel economy (mpg)", from 30 to 65, numbered every 5, with 5 small squares between numbered values (each small square is 1). 13 points are plotted as crosses: (1, 61), (1.2, 58), (1.2, 55), (1.4, 54), (1.5, 52), (1.6, 49), (1.8, 50), (2, 46), (2, 43), (2.2, 42), (2.5, 40), (2.7, 37) and (3, 33).

Model answer

Negative correlation.
Cars with larger engines tend to travel fewer miles per gallon, so they use more fuel for each mile.

Explanation

The points go down from left to right, which is negative correlation: as one variable increases, the other tends to decrease. Always describe what this means using the names of the variables in the question.

Mark scheme
  1. 1 mark

    B1 for negative (correlation)

    Accept 'strong negative'. Do not accept 'inverse proportion'.

  2. 1 mark

    B1 for cars with bigger engines tend to travel fewer miles per gallon (have worse fuel economy) oe

    Must be in context. Accept 'as engine size increases, fuel economy decreases'. Condone causal wording such as 'bigger engines give lower mpg'.
Question 2

2 marks

A study of 30 towns found strong negative correlation between the number of libraries per 10 000 people and the crime rate.

A councillor says,

'If we build more libraries, crime in our town will go down.'

Give two reasons why the councillor may be wrong.

Model answer

1. Correlation does not mean causation: the data show that towns with more libraries tend to have less crime, not that the libraries reduce crime.
2. A third factor could explain both, for example wealthier towns may have more libraries and also less crime. Building libraries would not change that factor.

Explanation

Two variables can be correlated because both depend on something else. To show that one causes the other you would need more evidence, such as a fair experiment. A pattern across many towns also may not predict what happens in one town.

Mark scheme
  1. 1 mark

    B1 for correlation does not show causation / libraries may not be the reason for lower crime

    Accept 'just because they are linked does not mean one causes the other'; correct answer with no working scores full marks

  2. 1 mark

    B1 for a different valid reason, e.g. another factor such as the wealth of a town could affect both / the pattern for 30 towns may not apply to one particular town / other changes could affect crime

    The two reasons must be different. Two versions of 'correlation is not causation' score B1 only.

Question 3

3 marks

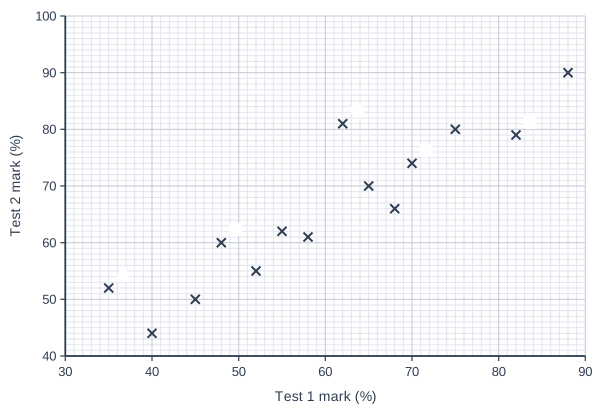
The scatter graph shows the marks, as percentages, of 14 students in two tests.
Five of the students are labelled A, B, C, D and E.

Which of these five students improved their mark by the greatest amount from Test 1 to Test 2?
Show how you decide.

Scatter graph on a grid of small squares. The horizontal axis is "Test 1 mark (%)", from 30 to 90, numbered every 10, with 10 small squares between numbered values (each small square is 1). The vertical axis is "Test 2 mark (%)", from 40 to 100, numbered every 10, with 10 small squares between numbered values (each small square is 1). 14 points are plotted as crosses: (40, 44), (45, 50), (52, 55), (55, 62), (58, 61), (65, 70), (68, 66), (75, 80) and (88, 90), plus (35, 52) labelled A, (48, 60) labelled B, (62, 81) labelled C, (70, 74) labelled D and (82, 79) labelled E.

Model answer

Improvement = Test 2 mark − Test 1 mark
A: 52 − 35 = 17
B: 60 − 48 = 12
C: 81 − 62 = 19
D: 74 − 70 = 4
E: 79 − 82 = −3 (a fall)
Student C improved by the greatest amount, 19 percentage points.

Explanation

Each point gives a student's two marks: Test 1 across and Test 2 up. The improvement is the difference between them, so the point furthest above the diagonal line where Test 2 equals Test 1 has improved most. The student with the highest Test 2 mark is not necessarily the one who improved most.

Mark scheme
  1. 1 mark

    M1 for Test 2 mark − Test 1 mark for at least three of the labelled students

    A: 52 − 35 = 17; B: 60 − 48 = 12; C: 81 − 62 = 19; D: 74 − 70 = 4; E: 79 − 82 = −3 (exact readings).

  2. 1 mark

    M1 for the differences for all five students, or for A and C

  3. 1 mark

    A1 for C (with an improvement of 19)

    E (the highest Test 2 mark) or A (the biggest percentage increase, 48.6%) score M1 M1 A0 if the differences are correct.

Question 4

4 marks

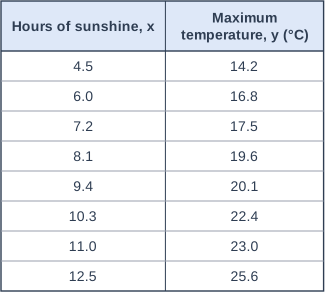
The table shows the number of hours of sunshine and the maximum temperature on 8 days in a town.

A line of best fit should pass through the mean point (mean of the x-values, mean of the y-values).

Kim draws a line of best fit on a scatter graph of this data.
Her line passes through the points (4, 12) and (12, 22).

Work out the mean point, and decide whether Kim's line is a good line of best fit.

Table with columns "Hours of sunshine, x", "Maximum temperature, y (°C)". Hours of sunshine, x: 4.5; Maximum temperature, y (°C): 14.2 | Hours of sunshine, x: 6.0; Maximum temperature, y (°C): 16.8 | Hours of sunshine, x: 7.2; Maximum temperature, y (°C): 17.5 | Hours of sunshine, x: 8.1; Maximum temperature, y (°C): 19.6 | Hours of sunshine, x: 9.4; Maximum temperature, y (°C): 20.1 | Hours of sunshine, x: 10.3; Maximum temperature, y (°C): 22.4 | Hours of sunshine, x: 11.0; Maximum temperature, y (°C): 23.0 | Hours of sunshine, x: 12.5; Maximum temperature, y (°C): 25.6.

Model answer

Mean of the hours = (4.5 + 6.0 + 7.2 + 8.1 + 9.4 + 10.3 + 11.0 + 12.5) ÷ 8 = 69 ÷ 8 = 8.625
Mean of the temperatures = (14.2 + 16.8 + 17.5 + 19.6 + 20.1 + 22.4 + 23.0 + 25.6) ÷ 8 = 159.2 ÷ 8 = 19.9
Mean point = (8.625, 19.9)
Kim's line rises 22 − 12 = 10 over 12 − 4 = 8, so its gradient is 1.25 and its equation is y = 1.25x + 7.
At x = 8.625 her line gives 1.25 × 8.625 + 7 = 17.78..., not 19.9.
Her line passes about 2 °C below the mean point, so it is not a good line of best fit.

Explanation

The mean point lies in the middle of the data, so a good line of best fit passes through (or very close to) it. Find the mean of each variable, then check whether the line goes through that point, for example by working out the height of the line at x = 8.625.

Mark scheme
  1. 1 mark

    M1 for 69 ÷ 8 or 8.625

    Exact values: the hours total 69; correct answer with no working scores full marks

  2. 1 mark

    M1 for 159.2 ÷ 8 or 19.9

    Exact values: the temperatures total 159.2.

  3. 1 mark

    A1 for mean point (8.625, 19.9)

    Exact values. Accept (8.6, 19.9) or (8.63, 19.9).

  4. 1 mark

    B1 for No, with a correct check, e.g. at x = 8.625 Kim's line gives about 17.8 (not 19.9), so her line does not pass through the mean point

    Kim's line: gradient 10 ÷ 8 = 1.25, equation y = 1.25x + 7, giving 17.78125 at 8.625 (accept 17.7 to 17.8). Or: the point (8.625, 19.9) is above her line. FT their mean point.

Ready to try the rest? Every answer you write is marked against the mark scheme, so you can see exactly where the marks are.

Study Helper Hints first, answers after you try

Stuck on this one? Ask for a hint and I’ll point you in the right direction, without giving the answer away. Once you’ve checked your answer, I’ll show you how the marks are awarded.