Level:
Correct: 0
Incorrect: 0
Marks: 0/0
Exam Practice
Course:
Topics:
OCR GCSE Maths (Higher calculator) Smart practice A mixed round aimed at your weak spots
Unit 1
Number Operations and Integers
Unit 2
Fractions, Decimals and Percentages
Unit 3
Indices and Surds
Unit 4
Approximation and Estimation
Unit 5
Ratio, Proportion and Rates of Change
Unit 6
Algebra
Unit 7
Graphs of Equations and Functions
Unit 8
Basic Geometry
Unit 9
Congruence and Similarity
Unit 10
Mensuration
Unit 11
Probability
Unit 12
Statistics
Avg
score:
–
Topics
done:
0/121

Charts, tables and time series graphs

Practise 14 exam-style questions on Charts, tables and time series graphs for OCR GCSE Maths (Higher calculator). Write your answer as you would in the exam and get it marked in seconds against the mark scheme, point by point, with the Study Helper on hand if you get stuck.

  • 14 questions
  • 2–4 marks each
  • Instant marking
  • No sign-up needed
14 questions, marked as you go

Sample questions with model answers

Here are 4 of the questions in this topic, each with a model answer, an explanation of why it earns the marks and the mark scheme an examiner would use.

Question 1

2 marks

160 households were asked how many people live in their household.

The bar chart shows the results.

What percentage of the households have more than 3 people?
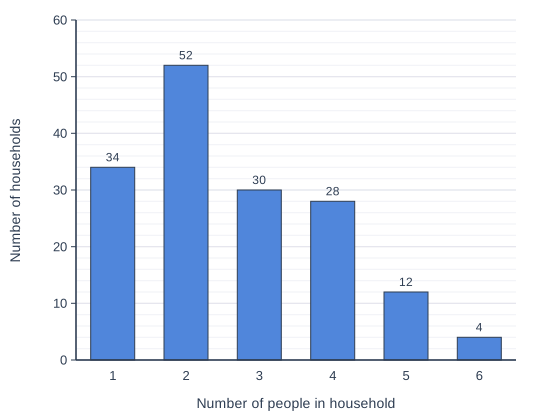
Bar chart of number of households for each number of people in household: 1 34, 2 52, 3 30, 4 28, 5 12, 6 4.

Model answer

More than 3 people means 4, 5 or 6 people.
Number of households = 28 + 12 + 4 = 44
Percentage = \(\dfrac{44}{160} \times 100 = 27.5\%\)

Explanation

'More than 3' does not include 3, so add the frequencies for 4, 5 and 6 people. Then write this as a fraction of all 160 households and multiply by 100. A common error is to include the households with exactly 3 people.

Mark scheme
  1. 1 mark

    M1 for \(\dfrac{28 + 12 + 4}{160}\) or \(\dfrac{44}{160}\)

    Exact values from the chart. Or 44 seen; correct answer with no working scores full marks

  2. 1 mark

    A1 for 27.5 (%)

    Exact answer (cao). 46.25 (including households of 3, from 74 ÷ 160) scores M0 A0.
Question 2

2 marks

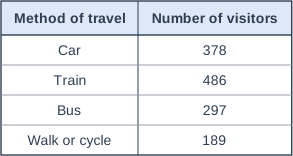
The table shows how 1350 visitors travelled to a festival.

Ella draws a pie chart to show this information.
She uses an angle of 129° for Train, to the nearest degree.

Is Ella's angle correct?
Show how you decide.

Table with columns "Method of travel", "Number of visitors". Method of travel: Car; Number of visitors: 378 | Method of travel: Train; Number of visitors: 486 | Method of travel: Bus; Number of visitors: 297 | Method of travel: Walk or cycle; Number of visitors: 189.

Model answer

Angle for Train = \(\dfrac{486}{1350} \times 360 = 129.6^\circ\)
To the nearest degree this is 130°, not 129°.
No, Ella's angle is not correct.

Explanation

Each visitor is \(\dfrac{360}{1350}\) of a degree, so multiply 486 by \(\dfrac{360}{1350}\). 129.6 rounds up to 130 because the first decimal digit is 6. Ella has truncated instead of rounding.

Mark scheme
  1. 1 mark

    M1 for \(\dfrac{486}{1350} \times 360\) oe

    Exact values from the table. Or 360 ÷ 1350 × 486, or 1350 ÷ 360 = 3.75 visitors per degree and 486 ÷ 3.75.

  2. 1 mark

    A1 for No, with 129.6 or 130

    Accept 129.6 (exact) rounding to 130. 'No' with no working scores 0. 'Yes' from truncating 129.6 scores M1 A0.

Question 3

3 marks

Here are the masses, in kilograms, of 20 parcels.

0.8   1.6   2.0   2.3   3.9   4.0   4.1   1.2   5.5   2.8
3.1   4.6   0.5   2.0   3.6   5.0   1.9   4.4   3.3   2.6

Tom is putting the masses into the grouped frequency table.

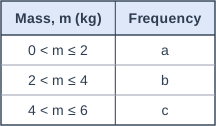
Work out the values of \(a\), \(b\) and \(c\) in the table.

Table with columns "Mass, m (kg)", "Frequency". Mass, m (kg): 0 < m ≤ 2; Frequency: a | Mass, m (kg): 2 < m ≤ 4; Frequency: b | Mass, m (kg): 4 < m ≤ 6; Frequency: c.

Model answer

0 < m ≤ 2 includes 2.0 but not anything above it: 0.5, 0.8, 1.2, 1.6, 1.9, 2.0, 2.0, so \(a = 7\).
2 < m ≤ 4: 2.3, 2.6, 2.8, 3.1, 3.3, 3.6, 3.9, 4.0, so \(b = 8\).
4 < m ≤ 6: 4.1, 4.4, 4.6, 5.0, 5.5, so \(c = 5\).
Check: 7 + 8 + 5 = 20.

Explanation

The inequality signs decide where a boundary value goes: '≤ 2' includes 2, and '2 <' does not, so a mass of exactly 2.0 kg goes in the first class and 4.0 kg goes in the second. Ticking off each value as you place it, and checking that the frequencies add up to 20, avoids missing or double-counting.

Mark scheme
  1. 1 mark

    B1 for \(a = 7\)

    0.5, 0.8, 1.2, 1.6, 1.9, 2.0, 2.0. The two masses of 2.0 belong in 0 < m ≤ 2; correct answer with no working scores full marks

  2. 1 mark

    B1 for \(b = 8\)

    2.3, 2.6, 2.8, 3.1, 3.3, 3.6, 3.9, 4.0. The mass of 4.0 belongs in 2 < m ≤ 4.

  3. 1 mark

    B1 for \(c = 5\)

    4.1, 4.4, 4.6, 5.0, 5.5. If 0 scored, SC1 for three frequencies adding to 20 (e.g. 5, 9, 6 from putting 2.0 and 4.0 in the higher classes).

Question 4

4 marks

A sports club has 1240 members.
Each member is a junior or an adult.
45% of the members are female.

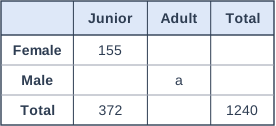
The two-way table shows some information about the members.

Work out the value of \(a\).

What percentage of the juniors are male?
Give your answer correct to 1 decimal place.

Table with columns (row headings), "Junior", "Adult", "Total". Female; Junior: 155; Adult: (blank); Total: (blank) | Male; Junior: (blank); Adult: a; Total: (blank) | Total; Junior: 372; Adult: (blank); Total: 1240.

Model answer

Females = 45% of 1240 = 558, so males = 1240 − 558 = 682
Junior males = 372 − 155 = 217
Adult males: \(a = 682 - 217 = 465\)
Percentage of juniors who are male = \(\dfrac{217}{372} \times 100 = 58.33...\%\)
= 58.3% (1 d.p.)
(Check: adults = 1240 − 372 = 868 and adult females = 558 − 155 = 403; 868 − 403 = 465.)

Explanation

Use the percentage to fill in the female and male totals, then use the fact that each row and column adds up to its total. The percentage of juniors who are male must be out of the 372 juniors, not out of all 1240 members.

Mark scheme
  1. 1 mark

    M1 for \(0.45 \times 1240\) or 558 females

    Exact values. Or 0.55 × 1240 = 682 males; correct answer with no working scores full marks

  2. 1 mark

    M1 for 682 males, or 403 adult females, or 217 junior males

    From 1240 − 558, 558 − 155, 372 − 155.

  3. 1 mark

    A1 for \(a = 465\)

    Exact answer (cao). From 682 − 217 or 868 − 403 (868 adults).

  4. 1 mark

    B1 for 58.3 (%)

    Accept 58.3 to 58.34 (58.33...), from 217 ÷ 372 × 100. FT their junior males ÷ 372 × 100. 17.5 (217 ÷ 1240) scores B0.

Ready to try the rest? Every answer you write is marked against the mark scheme, so you can see exactly where the marks are.

Study Helper Hints first, answers after you try

Stuck on this one? Ask for a hint and I’ll point you in the right direction, without giving the answer away. Once you’ve checked your answer, I’ll show you how the marks are awarded.