Question 1
2 marksZoe has some data about the heights of 80 sunflowers in a grouped frequency table.
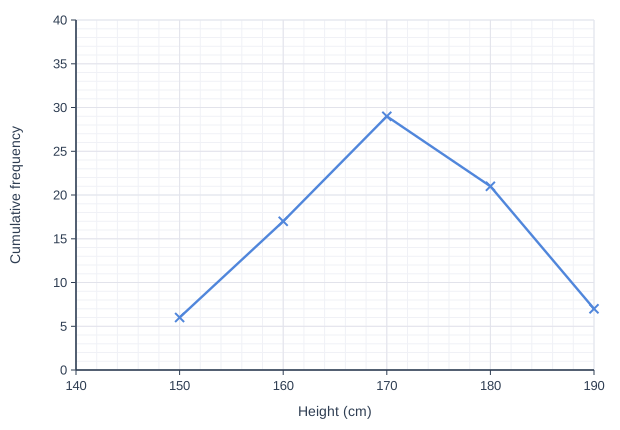
She draws the graph shown and says it is a cumulative frequency graph of the data.
Explain why Zoe's graph cannot be a cumulative frequency graph.
Describe the mistake she has made.
Model answer
A cumulative frequency is a running total, so it can only stay the same or increase. Zoe's graph goes down after 170 cm, so it cannot be a cumulative frequency graph.
Zoe has plotted the frequency of each class instead of the cumulative frequencies. Her graph should end at the total, 80, but her last point is at 7.
Explanation
Each cumulative frequency adds the next class onto all the classes before it, so the graph rises (or stays level for an empty class) and finishes at the total number of items. Zoe's values 6, 17, 29, 21, 7 are the separate class frequencies; the running totals would be 6, 23, 52, 73 and 80.
Mark scheme
-
1 mark
B1 for a cumulative frequency graph can never go down / must always increase or stay level
Accept 'the graph decreases after 170'. Do not accept 'it is not a smooth curve' (a cumulative frequency polygon is allowed).
-
1 mark
B1 for she has plotted the frequencies, not the running totals (cumulative frequencies)
Accept 'she has not added up the frequencies' or 'the last point should be at 80, the total'. Accept 'the points add up to 80 but the graph should end at 80'.