Level:
Correct: 0
Incorrect: 0
Marks: 0/0
Exam Practice
Course:
Topics:
OCR GCSE Maths (Higher calculator) Smart practice A mixed round aimed at your weak spots
Unit 1
Number Operations and Integers
Unit 2
Fractions, Decimals and Percentages
Unit 3
Indices and Surds
Unit 4
Approximation and Estimation
Unit 5
Ratio, Proportion and Rates of Change
Unit 6
Algebra
Unit 7
Graphs of Equations and Functions
Unit 8
Basic Geometry
Unit 9
Congruence and Similarity
Unit 10
Mensuration
Unit 11
Probability
Unit 12
Statistics
Avg
score:
–
Topics
done:
0/121

Real-life graphs

Practise 14 exam-style questions on Real-life graphs for OCR GCSE Maths (Higher calculator). Write your answer as you would in the exam and get it marked in seconds against the mark scheme, point by point, with the Study Helper on hand if you get stuck.

  • 14 questions
  • 1–4 marks each
  • Instant marking
  • No sign-up needed
14 questions, marked as you go

Sample questions with model answers

Here are 4 of the questions in this topic, each with a model answer, an explanation of why it earns the marks and the mark scheme an examiner would use.

Question 1

2 marks

Leon cycled from his home to a lake and back again.
On the way back he stopped at a friend's house.

The graph shows Leon's distance from home.

Leon says,

'I cycled 13.5 km altogether.'

Explain why Leon is wrong and work out the total distance he cycled.
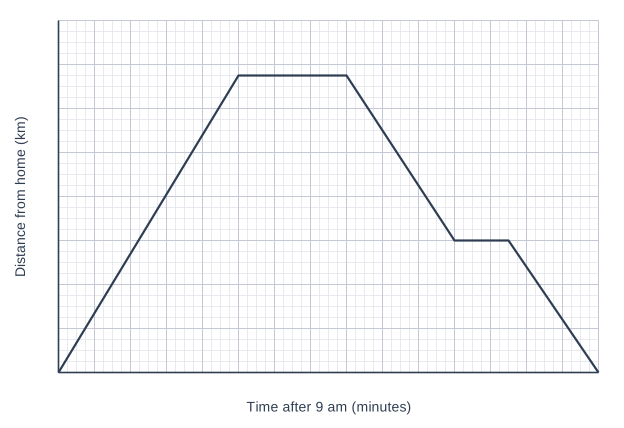
A graph of Distance from home (km) (vertical axis, 0 to 16, marked every 2) against Time after 9 am (minutes) (horizontal axis, 0 to 150, marked every 10), on a grid with 4 small squares to each large square. The graph is made of straight-line sections joining (0, 0), (50, 13.5), (80, 13.5), (110, 6), (125, 6) and (150, 0).

Model answer

The graph shows Leon's distance from home, not the total distance he cycled. 13.5 km is only the distance from his home to the lake; he then cycled 13.5 km back.
There: 13.5 km
Back: 13.5 − 6 = 7.5 km to his friend's house, then 6 km home
Total = 13.5 + 7.5 + 6 = 27 km

Explanation

The vertical axis shows how far Leon is from home at each time, so the highest point is the furthest he got, not how far he travelled. The downward sections are the return journey, and the horizontal sections are stops, where he did not move. So the total distance is twice 13.5 km.

Mark scheme
  1. 1 mark

    B1 for 13.5 km is only the distance from his home to the lake / his greatest distance from home, and he also cycled back

    Accept 'he has only counted the journey there' or 'the graph shows distance from home, not total distance'.

  2. 1 mark

    B1 for 27 (km)

    From \(13.5 \times 2\) or \(13.5 + 7.5 + 6\). Do not accept answers that add distance for the stops, e.g. 33 or 40.5.
Question 2

2 marks

Sunita invests £2500 in a savings account.

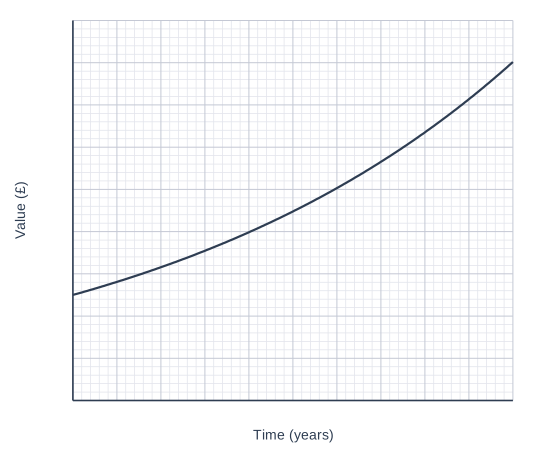
The graph shows the value of her investment over 20 years.

Use the graph to estimate the number of years it takes for the value of her investment to double.

A graph of Value (£) (vertical axis, 0 to 9000, marked every 1000) against Time (years) (horizontal axis, 0 to 20, marked every 2), on a grid with 5 small squares to each large square. The curve is an exponential curve, increasing more and more steeply from left to right; its key points can be read from the grid.

Model answer

The investment starts at £2500, so it has doubled when it is worth 2 × £2500 = £5000.
Go across from £5000 to the curve and down to the time axis.
It takes about 12 years.

Explanation

The starting value is where the curve meets the vertical axis, £2500, so double is £5000. Read across from £5000 to the curve and down. The curve gets steeper because the interest each year is added to a larger amount.

Mark scheme
  1. 1 mark

    M1 for a reading from £5000 on the value axis

    Or £5000 identified as double the starting value.

  2. 1 mark

    A1 for 12 (years)

    Accept 11.5 to 12.5 (the exact value is 11.9). 6 (from reading at £3750 or halving 12) or 10 (assuming the value doubles in half the time shown) scores M0 A0.

Question 3

3 marks

Rhys drove from 8 am until 2 pm.
He stopped once to buy fuel.

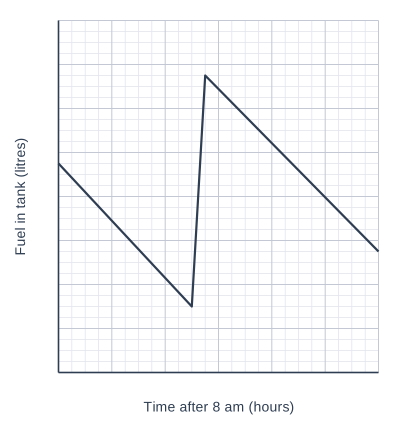
The graph shows the amount of fuel in his car's tank.

Fuel cost 142.9p per litre.

Work out how much Rhys paid for the fuel he bought.
Give your answer to the nearest penny.

A graph of Fuel in tank (litres) (vertical axis, 0 to 64, marked every 8) against Time after 8 am (hours) (horizontal axis, 0 to 6, marked every 1), on a grid with 4 small squares to each large square. The graph is made of straight-line sections; its values can be read from the grid.

Model answer

The fuel goes up from 12 litres to 54 litres when Rhys stops.
Fuel bought = 54 − 12 = 42 litres
Cost = 42 × 142.9 = 6001.8p = £60.018
£60.02

Explanation

The steep rising section is when fuel went into the tank, so read the amount just before and just after it and subtract. Multiply by the price per litre and change pence to pounds by dividing by 100. A common error is to use 54 litres, the amount in the tank afterwards, rather than the amount added.

Mark scheme
  1. 1 mark

    B1 for 42 (litres)

    From 54 − 12. Accept readings giving 41 to 43; correct answer with no working scores full marks

  2. 1 mark

    M1 for their 42 × 142.9 or their 42 × 1.429

    142.9 and 1.429 are exact values from the question. Their 42 must come from a difference of two readings. 54 × 1.429 (= 77.17) scores B0 M1 A0.

  3. 1 mark

    A1 for £60.02

    Accept 6002p. Allow 60.018 seen. FT their reading: e.g. 41 litres gives £58.59, 43 litres gives £61.45, for M1 A1.

Question 4

4 marks

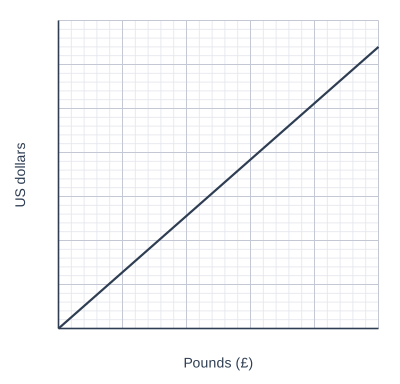
The graph can be used to convert between pounds (£) and US dollars.

A pair of headphones costs £149 in a shop in the UK.
The same headphones cost 179 US dollars in a shop in New York.

In which shop are the headphones cheaper, and by how much?
Give your answer in pounds, to the nearest penny.

A graph of US dollars (vertical axis, 0 to 70, marked every 10) against Pounds (£) (horizontal axis, 0 to 50, marked every 10), on a grid with 5 small squares to each large square. The graph is a straight line; its values can be read from the grid.

Model answer

From the graph, £50 = 64 US dollars, so £1 = 64 ÷ 50 = 1.28 US dollars.
New York price in pounds = 179 ÷ 1.28 = £139.84375
Difference = 149 − 139.84375 = £9.15625
The headphones are cheaper in New York, by £9.16.

Explanation

The graph only goes up to £50, so read a convenient pair of values and use it as a rate. Convert the New York price into pounds so that both prices are in the same currency, then subtract. A common error is to give the difference in US dollars instead of pounds.

Mark scheme
  1. 1 mark

    M1 for a correct pair of values from the graph

    For example £50 = 64 US dollars, £25 = 32 US dollars, or 1.28 US dollars per pound. Allow 63 to 65 for £50; correct answer with no working scores full marks

  2. 1 mark

    M1 for 179 US dollars converted to pounds using their values, e.g. \(179 \div 1.28\) or \(179 \times \dfrac{50}{64}\)

    Accept 139.8 to 139.85 (139.84375). Or M1 for £149 converted to US dollars, \(149 \times 1.28 = 190.72\), and the difference 11.72 US dollars found.

  3. 1 mark

    M1 for 149 − their 139.84 or their difference in US dollars converted to pounds

    For example 11.72 ÷ 1.28. Accept their value from 139.8 to 139.85, or better.

  4. 1 mark

    A1 for New York (shop) and £9.16

    Accept 9.15 to 9.16 (9.15625). FT a reading of 63 to 65 for £50: answers from 6.94 to 11.31. 11.72 (the difference in US dollars) as the final answer scores M1 M1 M0 A0.

Ready to try the rest? Every answer you write is marked against the mark scheme, so you can see exactly where the marks are.

Study Helper Hints first, answers after you try

Stuck on this one? Ask for a hint and I’ll point you in the right direction, without giving the answer away. Once you’ve checked your answer, I’ll show you how the marks are awarded.