
Level:
Correct: 0
Incorrect: 0
Marks: 0/0
Exam Practice
Course:
Topics:
OCR GCSE Maths (Higher calculator) Smart practice A mixed round aimed at your weak spots
Unit 1
Number Operations and Integers
Unit 2
Fractions, Decimals and Percentages
Unit 3
Indices and Surds
Unit 4
Approximation and Estimation
Unit 5
Ratio, Proportion and Rates of Change
Unit 6
Algebra
Unit 7
Graphs of Equations and Functions
Unit 8
Basic Geometry
Unit 9
Congruence and Similarity
Unit 10
Mensuration
Unit 11
Probability
Unit 12
Statistics
Avg
score:
–
Topics
done:
0/121

Comparing data and misleading graphs

Practise 15 exam-style questions on Comparing data and misleading graphs for OCR GCSE Maths (Higher calculator). Write your answer as you would in the exam and get it marked in seconds against the mark scheme, point by point, with the Study Helper on hand if you get stuck.

  • 15 questions
  • 1–4 marks each
  • Instant marking
  • No sign-up needed
15 questions, marked as you go

Sample questions with model answers

Here are 4 of the questions in this topic, each with a model answer, an explanation of why it earns the marks and the mark scheme an examiner would use.

Question 1

1 mark

Emma measures the heights of a random sample of 50 adults in the UK.
The mean height of the adults in her sample is 170.6 cm.

Emma says,

'The mean height of all adults in the UK is 170.6 cm.'

Explain why Emma's statement may not be correct.

Model answer

Emma has only measured a sample of 50 adults, not the whole population. Another random sample of 50 adults would probably give a different mean, so 170.6 cm is only an estimate of the mean height of all UK adults.

Explanation

Statistics from a sample describe the sample exactly but only estimate the same statistic for the population. A larger random sample usually gives a more reliable estimate, but it is still an estimate.

Mark scheme
  1. 1 mark

    B1 for the mean of a sample is only an estimate of the population mean / a different sample would give a different mean

    Accept 'the sample of 50 is small compared with the population, so the mean may be different'. Do not accept 'some people are taller than others'.
Question 2

2 marks

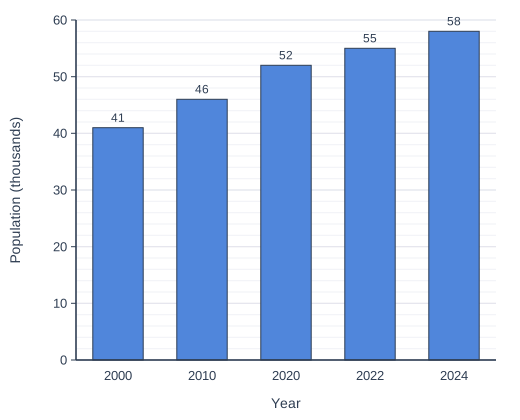
The bar chart shows the population of a town, in thousands, in five different years.

Explain why the bar chart could give a misleading impression of how quickly the population has grown.

Bar chart of population (thousands) for each year: 2000 41, 2010 46, 2020 52, 2022 55, 2024 58.

Model answer

The bars are equally spaced, but the years are not: 2000, 2010 and 2020 are 10 years apart, while 2020, 2022 and 2024 are only 2 years apart.
The chart makes the population growth look as if it slowed down after 2020, but it grew by about 0.5 to 0.6 thousand a year up to 2020 and by 1.5 thousand a year after 2020, so recent growth has been much faster than it looks.

Explanation

For data over time, the time intervals must be shown fairly. Equal spaces for unequal time periods distort the trend: here a change over 2 years is shown the same width as a change over 10 years. A line graph with a proper time scale would show the speed of growth correctly.

Mark scheme
  1. 1 mark

    B1 for the years are not equally spaced (10 years between the first three bars, 2 years between the last three)

    Accept 'the gaps between the years are different'.

  2. 1 mark

    B1 for so the recent growth looks slower than (or no faster than) the earlier growth, but the population grew much faster per year recently (1.5 thousand per year compared with 0.5 to 0.6 thousand per year)

    Any correct consequence linked to the unequal intervals, e.g. 'the rise from 2020 to 2024 took only 4 years but looks like it took as long as 2000 to 2020'. Comments about the vertical axis score 0 (it starts at zero).

Question 3

3 marks

Here are the delivery times, in minutes, of 9 takeaway orders.

24   27   29   31   32   34   36   38   95

The order that took 95 minutes was delayed by an accident.

Work out how much the mean and the median each change if the time of 95 minutes is left out.
Which average is less affected?

Model answer

With 95: mean = 346 ÷ 9 = 38.44... minutes; median = 5th value = 32 minutes
Without 95: mean = 251 ÷ 8 = 31.375 minutes; median = (31 + 32) ÷ 2 = 31.5 minutes
The mean falls by about 7.1 minutes, but the median falls by only 0.5 minutes.
The median is much less affected by the unusual value.

Explanation

The mean uses every value, so one extreme value (an outlier) can change it a lot. The median depends only on the middle of the ordered data, so it hardly moves. This is why the median is often a better 'typical' value when the data contains an extreme value.

Mark scheme
  1. 1 mark

    M1 for both means: 346 ÷ 9 and 251 ÷ 8, or 38.4... and 31.375

    Accept 38.4 or better (38.44...); 31.375 is exact; correct answer with no working scores full marks

  2. 1 mark

    M1 for both medians: 32 and 31.5

    Exact values; 31.5 from (31 + 32) ÷ 2.

  3. 1 mark

    A1 for the mean falls by about 7.1 minutes, the median by only 0.5 minutes, so the median is less affected

    Accept 7.06 to 7.1 for the change in the mean (7.069...), and the conclusion 'median'.

Question 4

4 marks

Two machines, A and B, fill bags of rice. Each bag should contain 1 kg of rice.

Here are the masses, in kg, of 8 bags filled by machine A.

1.004   0.998   1.012   0.991   1.007   1.002   0.995   1.009

For bags filled by machine B, the mean mass is 1.006 kg and the range is 0.041 kg.

Which machine is better? Compare the two machines using the mean and the range.

Model answer

Machine A: total = 8.018 kg, so mean = 8.018 ÷ 8 = 1.00225 ≈ 1.002 kg
Range = 1.012 − 0.991 = 0.021 kg
Machine A's mean (1.002 kg) is closer to 1 kg than machine B's (1.006 kg).
Machine A's range (0.021 kg) is smaller than machine B's (0.041 kg), so its bags are more consistent.
Machine A is better.

Explanation

Compare like with like: work out the same statistics (mean and range) for machine A as you are given for machine B. Here 'better' means close to the target of 1 kg and consistent, not simply a higher or lower mean.

Mark scheme
  1. 1 mark

    M1 for 8.018 ÷ 8

    The total 8.018 is exact. Allow one error in the total for M1; correct answer with no working scores full marks

  2. 1 mark

    A1 for mean of A = 1.002 (kg)

    Accept 1.002 to 1.0023 (1.00225).

  3. 1 mark

    B1 for range of A = 0.021 (kg)

    Exact value (cao), from 1.012 − 0.991.

  4. 1 mark

    B1 for machine A is better: its mean is closer to 1 kg and its range is smaller, so its masses are more consistent

    Both comparisons needed, in context. FT their mean and range if both are compared correctly. 'A, because its mean is lower' scores B0: the aim is to be close to 1 kg.

Ready to try the rest? Every answer you write is marked against the mark scheme, so you can see exactly where the marks are.

Study Helper Hints first, answers after you try

Stuck on this one? Ask for a hint and I’ll point you in the right direction, without giving the answer away. Once you’ve checked your answer, I’ll show you how the marks are awarded.