Level:
Correct: 0
Incorrect: 0
Marks: 0/0
Exam Practice
Course:
Topics:
OCR GCSE Maths (Higher calculator) Smart practice A mixed round aimed at your weak spots
Unit 1
Number Operations and Integers
Unit 2
Fractions, Decimals and Percentages
Unit 3
Indices and Surds
Unit 4
Approximation and Estimation
Unit 5
Ratio, Proportion and Rates of Change
Unit 6
Algebra
Unit 7
Graphs of Equations and Functions
Unit 8
Basic Geometry
Unit 9
Congruence and Similarity
Unit 10
Mensuration
Unit 11
Probability
Unit 12
Statistics
Avg
score:
–
Topics
done:
0/121

Gradients and rates of change

Practise 16 exam-style questions on Gradients and rates of change for OCR GCSE Maths (Higher calculator). Write your answer as you would in the exam and get it marked in seconds against the mark scheme, point by point, with the Study Helper on hand if you get stuck.

  • 16 questions
  • 2–4 marks each
  • Instant marking
  • No sign-up needed
16 questions, marked as you go

Sample questions with model answers

Here are 4 of the questions in this topic, each with a model answer, an explanation of why it earns the marks and the mark scheme an examiner would use.

Question 1

2 marks

The graph shows the velocity of a cyclist during a period of 50 seconds.

Sophie says,

'The cyclist was not moving between 20 seconds and 35 seconds.'

Is Sophie correct? Give a reason for your answer.

Write down the acceleration of the cyclist between 20 seconds and 35 seconds.
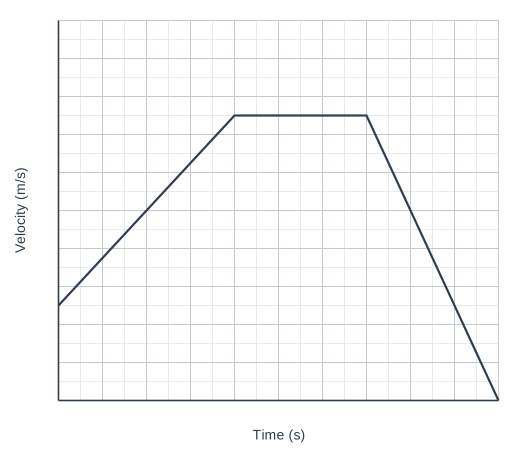
A graph of Velocity (m/s) (vertical axis, 0 to 10, marked every 1) against Time (s) (horizontal axis, 0 to 50, marked every 5), on a grid with 2 small squares to each large square. The graph is made of straight-line sections joining (0, 2.5), (20, 7.5), (35, 7.5) and (50, 0).

Model answer

No. This is a velocity-time graph, so a horizontal line means the velocity is not changing. Between 20 s and 35 s the cyclist was moving at a constant velocity of 7.5 m/s.
The gradient of a horizontal line is 0, so the acceleration was 0 m/s².

Explanation

On a distance-time graph a horizontal line means the object is stationary, but on a velocity-time graph it means constant velocity. The acceleration is the gradient of the velocity-time graph, and a horizontal line has gradient 0. The cyclist would only be stationary where the graph is on the time axis (velocity 0).

Mark scheme
  1. 1 mark

    B1 for No, because the cyclist's velocity was 7.5 m/s / the cyclist was moving at a constant velocity

    Must refer to constant (or 7.5 m/s) velocity or speed. 'No, the line is not at zero' with no mention of velocity is BOD. Do not accept 'No, because the cyclist was slowing down'.

  2. 1 mark

    B1 for 0 (m/s²)

    Accept 'zero' or 'no acceleration'.
Question 2

3 marks

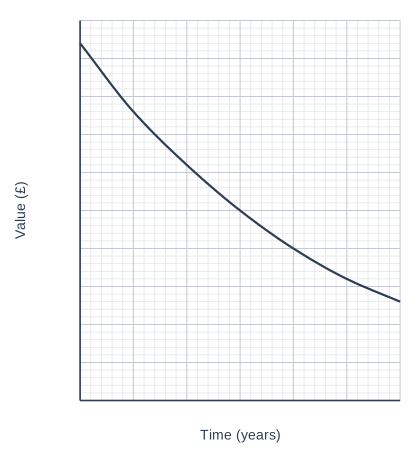
The graph shows the value of a car over the first 6 years after it was bought.

Work out the average rate at which the value of the car decreased between the end of year 1 and the end of year 4.
Give your answer in pounds per year.

A graph of Value (£) (vertical axis, 0 to 20000, marked every 2000) against Time (years) (horizontal axis, 0 to 6, marked every 1), on a grid with 5 small squares to each large square. The curve is a smooth curve; its values can be read from the grid.

Model answer

From the graph:
value at 1 year = £15 200
value at 4 years = £8000
Average rate of decrease = (15 200 − 8000) ÷ (4 − 1) = 7200 ÷ 3 = £2400 per year

Explanation

The average rate of change between two times is the gradient of the chord joining the two points on the graph. The value fell by £7200 in 3 years, so on average it fell by £2400 each year. The curve shows that the car loses value fastest when it is new.

Mark scheme
  1. 1 mark

    B1 for readings of £15 200 at 1 year and £8000 at 4 years

    Accept readings within £200 of these values (half a small square); correct answer with no working scores full marks

  2. 1 mark

    M1 for (their 15 200 − their 8000) ÷ (4 − 1)

    Or 7200 ÷ 3.

  3. 1 mark

    A1 for 2400

    Accept 2270 to 2530 from readings within tolerance. Accept −2400. 7200 (not divided by the time) scores B1 M0 A0. 1800 (dividing by 4) scores B1 M0 A0.

Question 3

3 marks

Kian went for a bike ride.
The graph shows his distance from home.

Kian says,

'My speed was 24 km/h for the first part and 18 km/h for the last part, so my average speed for the whole ride was 21 km/h.'

Is Kian correct?
Show how you decide.

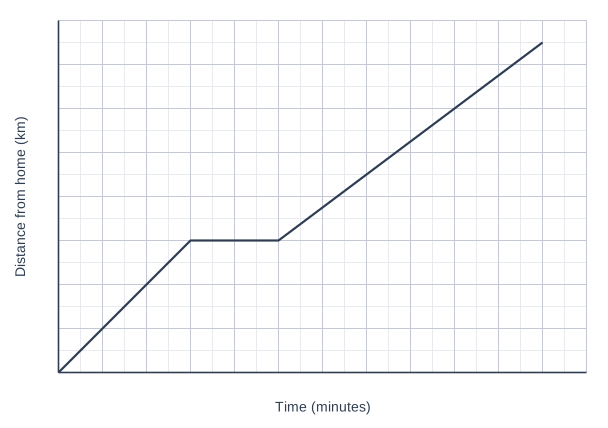
A graph of Distance from home (km) (vertical axis, 0 to 16, marked every 2) against Time (minutes) (horizontal axis, 0 to 60, marked every 5), on a grid with 2 small squares to each large square. The graph is made of straight-line sections joining (0, 0), (15, 6), (25, 6) and (55, 15).

Model answer

Total distance = 15 km
Total time = 55 minutes = \(\dfrac{55}{60}\) hours = 0.9166... hours
Average speed = 15 ÷ 0.9166... = 16.36... km/h
No, Kian is not correct: his average speed was about 16.4 km/h, not 21 km/h.
(He cannot find the mean of 24 and 18: he spent longer at 18 km/h, and he also stopped for 10 minutes.)

Explanation

Average speed for a whole journey is total distance ÷ total time, including stops. You cannot take the mean of two speeds unless they last for equal times; Kian rode at 18 km/h for twice as long as at 24 km/h, and stopped for 10 minutes. The average speed is the gradient of the straight line from the start of the graph to the end.

Mark scheme
  1. 1 mark

    M1 for total distance 15 km and total time 55 minutes

    Or 15 km and \(\dfrac{55}{60}\) hours (accept 0.916 or 0.917 hours).

  2. 1 mark

    M1 for \(15 \div \dfrac{55}{60}\) oe

    Or \(\dfrac{15}{55} \times 60\).

  3. 1 mark

    A1 for No, with 16.4 (km/h)

    Accept 16.3 to 16.4 (16.36...). Or 'No' with 20 km/h, the average moving speed from 15 ÷ 0.75, scores M1 M1 A1 only if the reason says the average is not the mean of the two speeds. 'No' with no correct values scores 0.

Question 4

4 marks

P is the point (3, 8) on the curve \(y = 2^x\).
Q is another point on the curve, close to P.

The table shows the gradient of the chord PQ for different x-coordinates of Q.

Work out the values of \(a\) and \(b\), correct to 4 significant figures.

Use your results to estimate the gradient of the curve at P, correct to 3 significant figures.

Table with columns "x-coordinate of Q", "3.1", "3.01", "3.001". x-coordinate of Q: Gradient of chord PQ; 3.1: 5.742; 3.01: a; 3.001: b.

Model answer

When Q has x-coordinate 3.01: gradient = \(\dfrac{2^{3.01} - 8}{0.01} = \dfrac{8.05564... - 8}{0.01} = 5.56444...\)
\(a = 5.564\) (4 s.f.)
When Q has x-coordinate 3.001: gradient = \(\dfrac{2^{3.001} - 8}{0.001} = \dfrac{8.005547... - 8}{0.001} = 5.54709...\)
\(b = 5.547\) (4 s.f.)
As Q gets closer to P the chord gradients 5.742, 5.564, 5.547 decrease towards the gradient of the tangent at P, which is a little less than 5.547.
Estimate: gradient at P = 5.55 (3 s.f.)

Explanation

The gradient of the curve at P is the gradient of the tangent there, and chords from P to points closer and closer to P have gradients that get closer to it. With a calculator you can make Q very close to P. The chord gradients are slightly too big because the curve gets steeper to the right of P, so the estimate should be just below the last value.

Mark scheme
  1. 1 mark

    M1 for \(\dfrac{2^{3.01} - 8}{3.01 - 3}\) or \(\dfrac{2^{3.001} - 8}{0.001}\)

    Accept 8.0556 or better for \(2^{3.01}\), 8.0055 or better for \(2^{3.001}\).

  2. 1 mark

    A1 for \(a = 5.564\)

    Accept 5.564 to 5.5645 (5.56444...).

  3. 1 mark

    A1 for \(b = 5.547\)

    Accept 5.547 to 5.5471 (5.54709...). Needs a correct method for b.

  4. 1 mark

    B1 for 5.55

    Accept 5.54 to 5.55 (the gradient of the tangent is 5.5451...). The estimate follows from the chord gradients decreasing towards the tangent gradient (at or just below b = 5.547, which rounds to 5.55). 5.74 or 5.56 as the estimate scores B0.

Ready to try the rest? Every answer you write is marked against the mark scheme, so you can see exactly where the marks are.

Study Helper Hints first, answers after you try

Stuck on this one? Ask for a hint and I’ll point you in the right direction, without giving the answer away. Once you’ve checked your answer, I’ll show you how the marks are awarded.