
Level:
Correct: 0
Incorrect: 0
Marks: 0/0
Exam Practice
Course:
Topics:
OCR GCSE Maths (Higher calculator) Smart practice A mixed round aimed at your weak spots
Unit 1
Number Operations and Integers
Unit 2
Fractions, Decimals and Percentages
Unit 3
Indices and Surds
Unit 4
Approximation and Estimation
Unit 5
Ratio, Proportion and Rates of Change
Unit 6
Algebra
Unit 7
Graphs of Equations and Functions
Unit 8
Basic Geometry
Unit 9
Congruence and Similarity
Unit 10
Mensuration
Unit 11
Probability
Unit 12
Statistics
Avg
score:
–
Topics
done:
0/121

Relative frequency

Practise 15 exam-style questions on Relative frequency for OCR GCSE Maths (Higher calculator). Write your answer as you would in the exam and get it marked in seconds against the mark scheme, point by point, with the Study Helper on hand if you get stuck.

  • 15 questions
  • 1–4 marks each
  • Instant marking
  • No sign-up needed
15 questions, marked as you go

Sample questions with model answers

Here are 4 of the questions in this topic, each with a model answer, an explanation of why it earns the marks and the mark scheme an examiner would use.

Question 1

2 marks

Kwame records the colour of each of 360 cars that pass his school.
The table shows his results.

Use his results to estimate the probability that the next car to pass the school is white or blue.
Give your answer as a decimal.

Table with columns "Colour", "Silver", "Black", "White", "Blue", "Red", "Other". Colour: Frequency; Silver: 97; Black: 84; White: 71; Blue: 46; Red: 39; Other: 23.

Model answer

Number of white or blue cars = 71 + 46 = 117
Estimated probability = relative frequency = \(\dfrac{117}{360} = 0.325\)

Explanation

The relative frequency of an outcome is the number of times it happened divided by the total number of trials, and it is used as an estimate of the probability. A car cannot be both white and blue, so add the two frequencies. Check that the frequencies add up to 360.

Mark scheme
  1. 1 mark

    M1 for \(\dfrac{71 + 46}{360}\) oe or \(\dfrac{117}{360}\)

    Or M1 for \(\dfrac{71}{360}\) + \(\dfrac{46}{360}\), or 0.197... + 0.127...

  2. 1 mark

    A1 for 0.325

    \(\dfrac{117}{360}\) or \(\dfrac{13}{40}\) as the final answer scores M1 A0 (the question asks for a decimal). Correct answer with no working scores 2 marks.
Question 2

3 marks

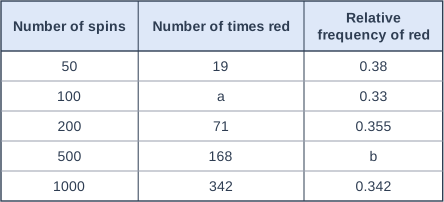
Zainab spins a biased spinner 1000 times.
After 50, 100, 200, 500 and 1000 spins, she records the total number of times the spinner has landed on red so far, and works out the relative frequency of red.

The table shows her results.

Work out the values of a and b in the table.
Write down the best estimate for the probability that the spinner lands on red, and give a reason for your choice.

Table with columns "Number of spins", "Number of times red", "Relative frequency of red". Number of spins: 50; Number of times red: 19; Relative frequency of red: 0.38 | Number of spins: 100; Number of times red: a; Relative frequency of red: 0.33 | Number of spins: 200; Number of times red: 71; Relative frequency of red: 0.355 | Number of spins: 500; Number of times red: 168; Relative frequency of red: b | Number of spins: 1000; Number of times red: 342; Relative frequency of red: 0.342.

Model answer

a = 0.33 × 100 = 33
b = \(\dfrac{168}{500} = 0.336\)
Best estimate = 0.342, because it is based on the greatest number of spins (1000).

Explanation

Relative frequency = number of reds ÷ number of spins, so each missing value comes from rearranging or using this. The relative frequency settles down as the number of trials increases, so the value after the most spins is the most reliable estimate of the probability.

Mark scheme
  1. 1 mark

    B1 for a = 33

    From 0.33 × 100.

  2. 1 mark

    B1 for b = 0.336

    From 168 ÷ 500. Accept \(\dfrac{168}{500}\) oe.

  3. 1 mark

    B1 for 0.342 with a reason, e.g. it is from the greatest number of spins / 1000 spins is the most trials

    Do not accept an average of the relative frequencies, or 0.38 (the first value). The reason must refer to the number of spins or trials.

Question 3

3 marks

A jar contains 18 lemon sweets and some other sweets.

Kit takes a sweet at random from the jar, writes down its flavour and puts it back.
He does this 300 times.
He takes a lemon sweet 72 times.

Use Kit's results to estimate the total number of sweets in the jar.

Model answer

Relative frequency of lemon = \(\dfrac{72}{300} = 0.24\)
So about 0.24 of the sweets are lemon.
\(0.24 \times n = 18\)
\(n = 18 \div 0.24 = 75\)
Estimate: 75 sweets in the jar.

Explanation

Because each sweet is put back, every pick is from the same jar, so the relative frequency of lemon estimates the fraction of the sweets that are lemon. The 18 lemon sweets are this fraction of the total. This is only an estimate: another 300 picks would give a slightly different answer.

Mark scheme
  1. 1 mark

    M1 for \(\dfrac{72}{300}\) oe or 0.24

    Relative frequency of lemon.

  2. 1 mark

    M1 for 18 ÷ their 0.24 oe

    Or M1 for \(\dfrac{18}{n} = \dfrac{72}{300}\) oe, or for 300 ÷ 72 × 18.

  3. 1 mark

    A1 for 75

    57 (the other sweets) scores M1 M1 A0. 18 × 0.24 = 4.32 scores M1 M0 A0. Correct answer with no working scores 3 marks.

Question 4

4 marks

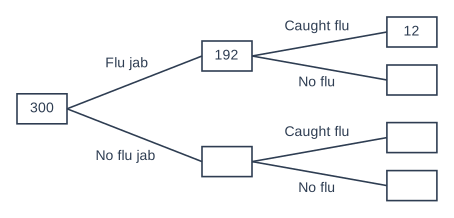
A doctor's surgery records whether 300 patients had a flu jab last winter, and whether they caught flu.
The frequency tree shows some of the results.

Altogether, 30 of the 300 patients caught flu.

The surgery says,

"Patients who did not have the flu jab were more than twice as likely to catch flu as patients who did have the flu jab."

Do the results support this?
Show how you decide.

A frequency tree drawn from left to right with 2 stages of branches. It starts from a box containing 300 on the left. From the first box, branches labelled "Flu jab" and "No flu jab" lead to a box containing 192 and an empty box respectively. From the "Flu jab" box, branches labelled "Caught flu" and "No flu" lead to a box containing 12 and an empty box respectively. From the "No flu jab" box, branches labelled "Caught flu" and "No flu" lead to an empty box and an empty box respectively.

Model answer

No flu jab: 300 − 192 = 108 patients
No flu jab and caught flu: 30 − 12 = 18 patients
Relative frequency of flu with the jab = \(\dfrac{12}{192}\) = 0.0625
Relative frequency of flu without the jab = \(\dfrac{18}{108}\) = 0.1666...
0.1666... ÷ 0.0625 = 2.66..., which is more than 2.
Yes, the results support the surgery: patients without the jab were about 2.7 times as likely to catch flu.

Explanation

Fill in the missing parts of the frequency tree by subtracting, then work out the relative frequency of catching flu separately for each group. Comparing the numbers 12 and 18 is not enough, because the groups are different sizes. Twice 0.0625 is 0.125, and 0.1666... is bigger than this.

Mark scheme
  1. 1 mark

    M1 for 300 − 192 or 108

    Patients with no flu jab.

  2. 1 mark

    M1 for 30 − 12 or 18

    Patients with no flu jab who caught flu.

  3. 1 mark

    M1 for \(\dfrac{18}{108}\) and \(\dfrac{12}{192}\) oe

    FT their 18 and 108. Accept 0.166... or 0.167 and 0.0625.

  4. 1 mark

    A1 for Yes, with a correct comparison, e.g. 0.166... > \(2 \times 0.0625 = 0.125\) / 0.166... \(\div\) 0.0625 = 2.66...

    Accept 'about 2.7 times as likely' with Yes. A decision with no correct figures scores 0 for this mark.

Ready to try the rest? Every answer you write is marked against the mark scheme, so you can see exactly where the marks are.

Study Helper Hints first, answers after you try

Stuck on this one? Ask for a hint and I’ll point you in the right direction, without giving the answer away. Once you’ve checked your answer, I’ll show you how the marks are awarded.