Level:
Correct: 0
Incorrect: 0
Marks: 0/0
Exam Practice
Course:
Topics:
OCR GCSE Maths (Higher calculator) Smart practice A mixed round aimed at your weak spots
Unit 1
Number Operations and Integers
Unit 2
Fractions, Decimals and Percentages
Unit 3
Indices and Surds
Unit 4
Approximation and Estimation
Unit 5
Ratio, Proportion and Rates of Change
Unit 6
Algebra
Unit 7
Graphs of Equations and Functions
Unit 8
Basic Geometry
Unit 9
Congruence and Similarity
Unit 10
Mensuration
Unit 11
Probability
Unit 12
Statistics
Avg
score:
–
Topics
done:
0/121

Averages and measures of spread

Practise 20 exam-style questions on Averages and measures of spread for OCR GCSE Maths (Higher calculator). Write your answer as you would in the exam and get it marked in seconds against the mark scheme, point by point, with the Study Helper on hand if you get stuck.

  • 20 questions
  • 2–4 marks each
  • Instant marking
  • No sign-up needed
20 questions, marked as you go

Sample questions with model answers

Here are 4 of the questions in this topic, each with a model answer, an explanation of why it earns the marks and the mark scheme an examiner would use.

Question 1

2 marks

The stem-and-leaf diagram shows the battery life, in hours, of 20 phones.

Work out the mean battery life.
Give your answer correct to 1 decimal place.
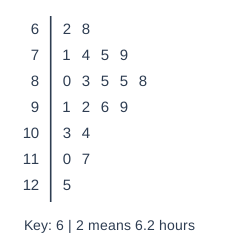
Stem and leaf diagram. Key: 6 | 2 means 6.2 hours. Rows (stem | leaves): 6 | 2 8; 7 | 1 4 5 9; 8 | 0 3 5 5 8; 9 | 1 2 6 9; 10 | 3 4; 11 | 0 7; 12 | 5.

Model answer

The values are 6.2, 6.8, 7.1, 7.4, 7.5, 7.9, 8.0, 8.3, 8.5, 8.5, 8.8, 9.1, 9.2, 9.6, 9.9, 10.3, 10.4, 11.0, 11.7, 12.5
Total = 178.7
Mean = 178.7 ÷ 20 = 8.935
Mean = 8.9 hours (1 d.p.)

Explanation

Use the key to read each value: here 6 | 2 means 6.2 hours. Add all 20 values and divide by 20. A stem-and-leaf diagram keeps the actual data values, so this mean is exact, not an estimate.

Mark scheme
  1. 1 mark

    M1 for 178.7 ÷ 20

    The total 178.7 is exact. Allow one error in the total for M1; correct answer with no working scores full marks

  2. 1 mark

    A1 for 8.9 (hours)

    Accept 8.9 to 8.935 (8.935). 8.5 (the mode) or 8.65 (the median) scores M0 A0. Reading the leaves as whole numbers, e.g. 62 for 6.2, scores M0 A0 unless corrected.
Question 2

3 marks

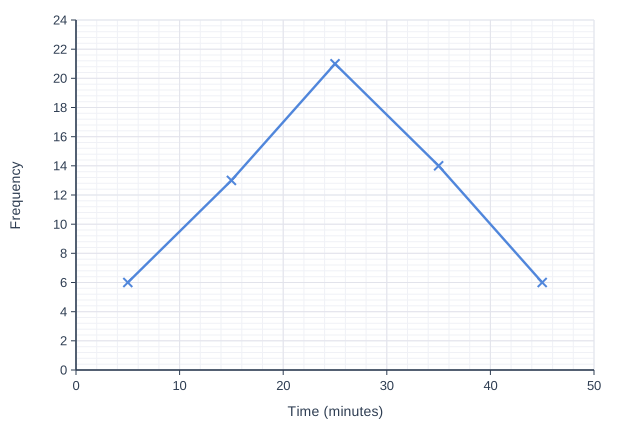
The frequency polygon shows information about the times, \(t\) minutes, that 60 students took to travel to school.
The times were grouped into the classes \(0 < t \leqslant 10\), \(10 < t \leqslant 20\), \(20 < t \leqslant 30\), \(30 < t \leqslant 40\) and \(40 < t \leqslant 50\).

Work out an estimate of the mean time.

Line graph of frequency (y-axis, 0 to 24) against time (minutes) (x-axis, 0 to 50). The line joins the points (5, 6), (15, 13), (25, 21), (35, 14), (45, 6).

Model answer

A frequency polygon plots each frequency at the class midpoint, so read off:
midpoints 5, 15, 25, 35, 45 with frequencies 6, 13, 21, 14, 6 (total 60)
Σfx = 30 + 195 + 525 + 490 + 270 = 1510
Estimated mean = 1510 ÷ 60 = 25.166... ≈ 25.2 minutes

Explanation

The points of a frequency polygon are already at the class midpoints, so their coordinates give the midpoint and the frequency of each class. Multiply, add and divide by the total frequency. It is an estimate because each student's time is replaced by the midpoint of their class.

Mark scheme
  1. 1 mark

    M1 for frequencies 6, 13, 21, 14, 6 read from the graph

    Plotted at the midpoints 5, 15, 25, 35, 45 (exact values).

  2. 1 mark

    M1 for \(\dfrac{5 \times 6 + 15 \times 13 + 25 \times 21 + 35 \times 14 + 45 \times 6}{60}\) or \(\dfrac{1510}{60}\)

    FT their frequencies, divided by their total.

  3. 1 mark

    A1 for 25.2 (minutes)

    Accept 25.1 to 25.2 (25.166...). 302 (1510 ÷ 5) scores M1 M0 A0.

Question 3

3 marks

A coach must choose one of two sprinters, Amir and Ben, for a 100 m race.
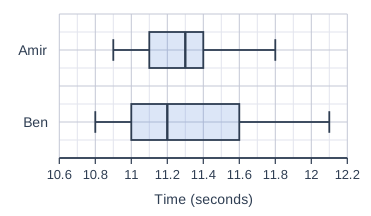
The box plots show information about their times in all their races this season.

The coach wants a sprinter who is fast and who is consistent.

Compare the times of the two sprinters, using the medians and the interquartile ranges.
Which sprinter would you choose? Give a reason.

2 box plots, one above the other, drawn above a horizontal scale "Time (seconds)" from 10.6 to 12.2, numbered every 0.2, with 2 small squares between numbered values (each small square is 0.1), on a grid of small squares. "Amir" (top): lowest value (left end of the left whisker) 10.9; lower quartile (left side of the box) 11.1; median (line inside the box) 11.3; upper quartile (right side of the box) 11.4; highest value (right end of the right whisker) 11.8. "Ben" (bottom): lowest value (left end of the left whisker) 10.8; lower quartile (left side of the box) 11; median (line inside the box) 11.2; upper quartile (right side of the box) 11.6; highest value (right end of the right whisker) 12.1.

Model answer

Medians: Amir 11.3 s, Ben 11.2 s. Ben's median is lower, so Ben was faster on average.
Interquartile ranges: Amir 11.4 − 11.1 = 0.3 s; Ben 11.6 − 11.0 = 0.6 s. Amir's IQR is smaller, so his times are more consistent.
I would choose Amir: his median is only 0.1 s slower than Ben's, but his times vary much less, so he is more likely to run close to his usual time.

Explanation

The median compares typical performance, and the interquartile range compares consistency: a smaller IQR means the middle half of the times are closer together. For running, a lower time is better, so a lower median means faster. Here the two measures point to different sprinters, so the choice depends on which matters more.

Mark scheme
  1. 1 mark

    B1 for comparing medians: Ben's median (11.2 s) is lower than Amir's (11.3 s), so Ben was faster on average

    Values or a correct statement in context needed. 'Ben has a lower median' with no context scores B1 only if 'so he is faster' or equivalent is given.

  2. 1 mark

    B1 for comparing interquartile ranges: Amir's IQR (0.3 s) is smaller than Ben's (0.6 s), so Amir's times are more consistent

    Values or a correct statement in context needed. Do not accept comparisons of the range only.

  3. 1 mark

    B1 for a choice consistent with their comparisons and the coach's wishes

    Either sprinter can be chosen with a sensible reason, e.g. 'Amir: he is only 0.1 s slower on average but much more consistent' or 'Ben: he is faster on average'. A choice with no reason scores B0.

Question 4

4 marks

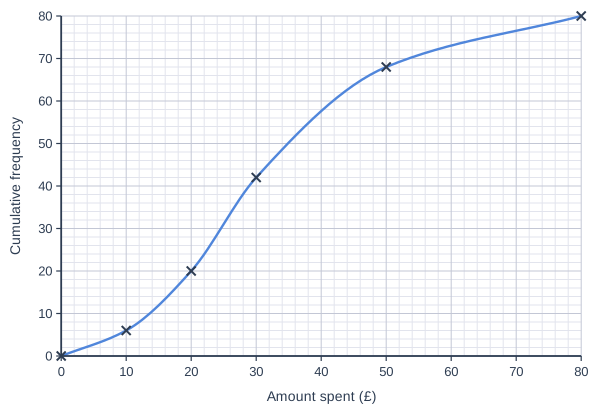
The cumulative frequency graph shows information about the amounts of money, in pounds, that 80 customers spent in a shop.

Work out an estimate of the mean amount spent per customer.
Give your answer to the nearest penny.

Cumulative frequency graph on a grid of small squares. The horizontal axis is "Amount spent (£)", from 0 to 80, numbered every 10, with 5 small squares between numbered values (each small square is 2). The vertical axis is "Cumulative frequency", from 0 to 80, numbered every 10, with 5 small squares between numbered values (each small square is 2). A smooth curve starts at (0, 0) and passes through (10, 6), (20, 20), (30, 42), (50, 68) and (80, 80) (each point is marked with a cross).

Model answer

Cumulative frequencies from the graph: 6 at £10, 20 at £20, 42 at £30, 68 at £50, 80 at £80
Frequencies: 6, 20 − 6 = 14, 42 − 20 = 22, 68 − 42 = 26, 80 − 68 = 12
Midpoints: 5, 15, 25, 40, 65
Σfx = 30 + 210 + 550 + 1040 + 780 = 2610
Estimated mean = 2610 ÷ 80 = 32.625
£32.63 (to the nearest penny)

Explanation

A cumulative frequency graph shows running totals, so subtract consecutive values to get back to the class frequencies. Then use the class midpoints as for any grouped table; the last two classes are wider, so their midpoints are 40 and 65. The mean is greater than the median here because a few customers spent a lot.

Mark scheme
  1. 1 mark

    M1 for frequencies 6, 14, 22, 26, 12 from the cumulative frequencies 6, 20, 42, 68, 80

    Exact values: the cumulative frequencies are plotted points.

  2. 1 mark

    M1 for midpoints 5, 15, 25, 40, 65

    At least four correct. Note the unequal classes 30 to 50 and 50 to 80.

  3. 1 mark

    M1 for \(\dfrac{5 \times 6 + 15 \times 14 + 25 \times 22 + 40 \times 26 + 65 \times 12}{80}\) or \(\dfrac{2610}{80}\)

    FT their frequencies and midpoints. Using the cumulative frequencies as frequencies scores M0 M1 M0.

  4. 1 mark

    A1 for £32.63

    Accept 32.62 to 32.63 (32.625). The median from the graph (about £28.90) scores 0.

Ready to try the rest? Every answer you write is marked against the mark scheme, so you can see exactly where the marks are.

Study Helper Hints first, answers after you try

Stuck on this one? Ask for a hint and I’ll point you in the right direction, without giving the answer away. Once you’ve checked your answer, I’ll show you how the marks are awarded.