
Level:
Correct: 0
Incorrect: 0
Marks: 0/0
Exam Practice
Course:
Topics:
OCR GCSE Maths (Foundation calculator) Smart practice A mixed round aimed at your weak spots
Unit 1
Number Operations and Integers
Unit 2
Fractions, Decimals and Percentages
Unit 3
Indices and Surds
Unit 4
Approximation and Estimation
Unit 5
Ratio, Proportion and Rates of Change
Unit 6
Algebra
Unit 7
Graphs of Equations and Functions
Unit 8
Basic Geometry
Unit 9
Congruence and Similarity
Unit 10
Mensuration
Unit 11
Probability
Unit 12
Statistics
Avg
score:
–
Topics
done:
0/100

Scatter graphs, correlation and outliers

Practise 14 exam-style questions on Scatter graphs, correlation and outliers for OCR GCSE Maths (Foundation calculator). Write your answer as you would in the exam and get it marked in seconds against the mark scheme, point by point, with the Study Helper on hand if you get stuck.

  • 14 questions
  • 1–4 marks each
  • Instant marking
  • No sign-up needed
14 questions, marked as you go

Sample questions with model answers

Here are 4 of the questions in this topic, each with a model answer, an explanation of why it earns the marks and the mark scheme an examiner would use.

Question 1

1 mark

Which one of these pairs of variables is most likely to show no correlation?

Choose your answer.

  • the height and the arm span of adults
  • the outside temperature and the cost of heating a house
  • the last digit of a person's phone number and their height
  • the age of a car and its value

Model answer

The last digit of a person's phone number and their height
The last digit of a phone number has nothing to do with how tall someone is, so there is no correlation.

Explanation

Correlation describes a relationship between two variables. Taller adults tend to have longer arm spans (positive), colder weather means higher heating costs (negative), and older cars tend to be worth less (negative). The last digit of a phone number is random, so it is not related to height.

Mark scheme
  1. 1 mark

    B1 for the last digit of a person's phone number and their height

    Height and arm span: positive correlation. Outside temperature and heating cost: negative. Age and value of a car: negative.
Question 2

2 marks

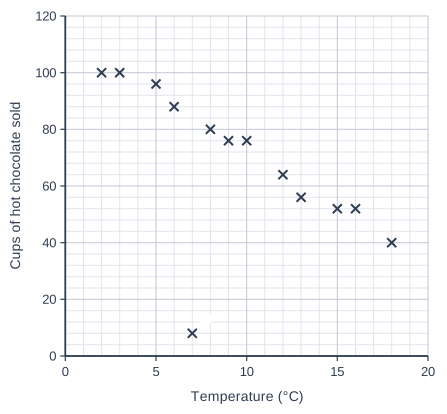
A café recorded the temperature and the number of cups of hot chocolate it sold on 13 days.

The scatter graph shows the results.

On one of the days, the number of cups sold was written down wrongly.

Write down the coordinates of the point that is most likely to be wrong.
Estimate the number of cups of hot chocolate that were really sold on that day.

Scatter graph on a grid of small squares. The horizontal axis is "Temperature (°C)", from 0 to 20, numbered every 5, with 5 small squares between numbered values (each small square is 1). The vertical axis is "Cups of hot chocolate sold", from 0 to 120, numbered every 20, with 5 small squares between numbered values (each small square is 4). 13 points are plotted as crosses: (2, 100), (3, 100), (5, 96), (6, 88), (8, 80), (9, 76), (10, 76), (12, 64), (13, 56), (15, 52), (16, 52) and (18, 40), plus a point labelled P. (The labelled point's coordinates can be read from the grid.)

Model answer

The point (7, 8) does not fit the pattern of the other points.
On the days at 6 °C and 8 °C the café sold 88 and 80 cups, so at 7 °C it probably sold about 84 cups.
Estimate: 84 cups (perhaps 84 was written down as 8).

Explanation

An outlier is a point that does not fit the pattern of the others. Outliers can be genuine, but they can also be errors in recording, such as a missed digit. Using the trend of the other points (strong negative correlation) at 7 °C gives a sensible estimate of the true value.

Mark scheme
  1. 1 mark

    B1 for (7, 8)

    Accept 'point P' with 7 °C and 8 cups.

  2. 1 mark

    B1 for an answer in the range 80 to 88

    From the pattern of the other points (or a line of best fit) at 7 °C. The days at 6 °C and 8 °C had 88 and 80 cups.

Question 3

2 marks

Jo measured the height of a sunflower at the end of each week for 8 weeks.
She drew a scatter graph of her results, and a line of best fit.

She uses her line of best fit to predict that the sunflower will be 345 cm tall after 30 weeks.

Give two reasons why her prediction may not be reliable.

Model answer

1. Jo only has data for weeks 1 to 8. 30 weeks is far outside this range, so the prediction is an extrapolation.
2. The sunflower is unlikely to keep growing at the same rate: it will stop growing when it is fully grown, and it may die before 30 weeks.

Explanation

Using a line of best fit within the range of the data (interpolation) is usually reasonable. Using it far outside the range (extrapolation) assumes the pattern continues, which is often not true in real life: plants stop growing. That is why extrapolated predictions may be unreliable.

Mark scheme
  1. 1 mark

    B1 for 30 weeks is outside the range of her data (weeks 1 to 8), so she is extrapolating oe

    Accept 'she only has data up to 8 weeks', 'it is too far beyond the data'; correct answer with no working scores full marks

  2. 1 mark

    B1 for the sunflower may stop growing / may not keep growing at the same rate / may die oe

    Accept 'the pattern may not continue', 'sunflowers do not grow forever'. Other creditworthy reason: 'she only measured one sunflower'. Max 2 marks; two versions of the same reason score 1 mark.

Question 4

4 marks

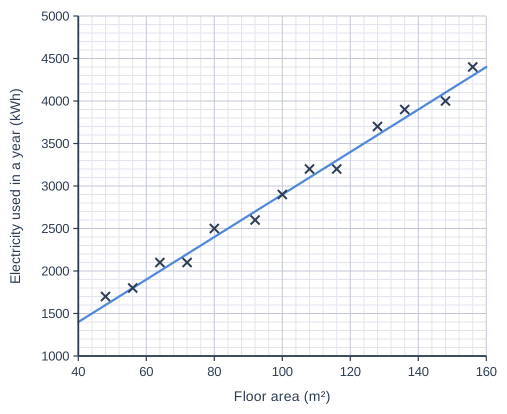
The scatter graph shows the floor area and the amount of electricity used in a year by 13 houses.
A line of best fit has been drawn.

The Kaur family's house has a floor area of 120 m².
Electricity costs 26.35p for each kWh.
The family plans to spend £70 each month on electricity.

Use the line of best fit to decide whether £70 each month is likely to be enough.
Show how you decide.

Scatter graph on a grid of small squares. The horizontal axis is "Floor area (m²)", from 40 to 160, numbered every 20, with 5 small squares between numbered values (each small square is 4). The vertical axis is "Electricity used in a year (kWh)", from 1000 to 5000, numbered every 500, with 5 small squares between numbered values (each small square is 100). 13 points are plotted as crosses: (48, 1700), (56, 1800), (64, 2100), (72, 2100), (80, 2500), (92, 2600), (100, 2900), (108, 3200), (116, 3200), (128, 3700), (136, 3900), (148, 4000) and (156, 4400). A straight line of best fit is drawn; it passes through (40, 1400) and (160, 4400).

Model answer

From the line of best fit, a house of 120 m² uses about 3400 kWh in a year.
Yearly cost = \(3400 \times 0.2635 = £895.90\)
Monthly cost = \(895.90 \div 12 = £74.66\)
£74.66 is more than £70, so £70 each month is not likely to be enough.

Explanation

Use the line of best fit to estimate the electricity used by a house of 120 m², then change kWh into pounds using the price. The cost is for a whole year, so compare it with 12 × £70 = £840, or divide by 12 to compare with £70. This is an estimate: the family's actual use could be different from the trend.

Mark scheme
  1. 1 mark

    B1 for 3400 (kWh) read from the line at 120 m²

    Accept 3300 to 3500. The line passes through (40, 1400) and (160, 4400).

  2. 1 mark

    M1 for their \(3400 \times 26.35\) or their \(3400 \times 0.2635\)

    Implied by 89 590 (pence) or 895.90 (pounds) for the year. Exact values from the question and graph.

  3. 1 mark

    M1 for a correct comparison method, e.g. \(70 \times 12 = 840\) with their yearly cost, or their yearly cost \(\div 12\)

    Implied by 74.66 (accept 74.6 to 74.7) per month. Exact values from the question.

  4. 1 mark

    A1 for No, with £895.90 per year more than £840 (or £74.66 per month more than £70) oe

    Accept values from readings in range: £869.55 to £922.25 per year, or £72.46 to £76.86 per month. 'No' with no correct values scores 0.

Ready to try the rest? Every answer you write is marked against the mark scheme, so you can see exactly where the marks are.

Study Helper Hints first, answers after you try

Stuck on this one? Ask for a hint and I’ll point you in the right direction, without giving the answer away. Once you’ve checked your answer, I’ll show you how the marks are awarded.