Level:
Correct: 0
Incorrect: 0
Marks: 0/0
Exam Practice
Course:
Topics:
OCR GCSE Maths (Foundation calculator) Smart practice A mixed round aimed at your weak spots
Unit 1
Number Operations and Integers
Unit 2
Fractions, Decimals and Percentages
Unit 3
Indices and Surds
Unit 4
Approximation and Estimation
Unit 5
Ratio, Proportion and Rates of Change
Unit 6
Algebra
Unit 7
Graphs of Equations and Functions
Unit 8
Basic Geometry
Unit 9
Congruence and Similarity
Unit 10
Mensuration
Unit 11
Probability
Unit 12
Statistics
Avg
score:
–
Topics
done:
0/100

Real-life graphs

Practise 16 exam-style questions on Real-life graphs for OCR GCSE Maths (Foundation calculator). Write your answer as you would in the exam and get it marked in seconds against the mark scheme, point by point, with the Study Helper on hand if you get stuck.

  • 16 questions
  • 1–4 marks each
  • Instant marking
  • No sign-up needed
16 questions, marked as you go

Sample questions with model answers

Here are 4 of the questions in this topic, each with a model answer, an explanation of why it earns the marks and the mark scheme an examiner would use.

Question 1

2 marks

Ruby switches on a kettle full of cold water.

The graph shows the temperature of the water in the kettle.

How many minutes did it take for the water to reach 100 °C?
Describe what happened to the temperature of the water after that.
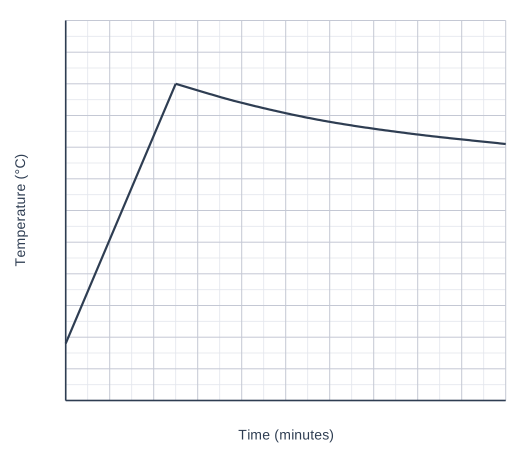
A graph of Temperature (°C) (vertical axis, 0 to 120, marked every 10) against Time (minutes) (horizontal axis, 0 to 10, marked every 1), on a grid with 2 small squares to each large square. The graph is a straight line; its values can be read from the grid. The curve is a smooth curve; its values can be read from the grid.

Model answer

The water reached 100 °C after 2.5 minutes.
After that the temperature went down slowly: the water cooled.

Explanation

Go across from 100 °C to the highest point of the graph and down to the time axis: 2.5 minutes. After this point the graph slopes downwards, so the temperature is falling, and it falls more and more slowly. A common error is to say the temperature stays the same after the water boils.

Mark scheme
  1. 1 mark

    B1 for 2.5 (minutes)

    Accept 2.4 to 2.6, or 2 minutes 30 seconds. Do not accept 2.30 unless it is clearly 2 minutes 30 seconds.

  2. 1 mark

    B1 for the temperature went down / the water cooled down oe

    Accept 'it dropped slowly', 'it decreased', 'the kettle switched off and the water cooled'. Ignore extra correct detail such as 'it fell to about 81 °C after 10 minutes'. Do not accept 'it stayed at 100 °C' or 'it went up'.
Question 2

2 marks

Tom is drawing a conversion graph between kilograms (kg) and pounds (lb).
He uses 1 kg = 2.2 lb.

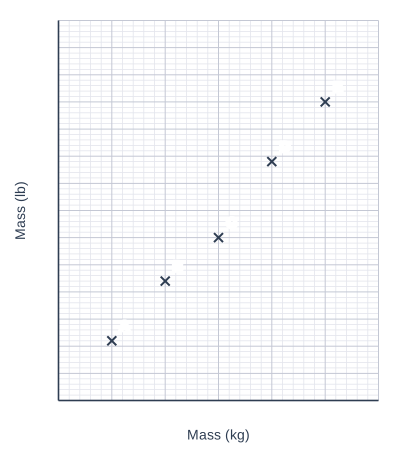
He has plotted five points, A, B, C, D and E, on the grid.
One of the points is plotted in the wrong place.

Which point is in the wrong place?
Give a reason for your answer.

A graph of Mass (lb) (vertical axis, 0 to 70, marked every 5) against Mass (kg) (horizontal axis, 0 to 30, marked every 5), on a grid with 5 small squares to each large square. Point A is marked with a cross at (5, 11). Point B is marked with a cross at (10, 22). Point C is marked with a cross at (15, 30). Point D is marked with a cross at (20, 44). Point E is marked with a cross at (25, 55).

Model answer

Point C
C is plotted at 15 kg and 30 lb.
\(15 \times 2.2 = 33\), so 15 kg = 33 lb.
C should be at (15, 33), not (15, 30).

Explanation

Check each point with 1 kg = 2.2 lb: 5 kg = 11 lb, 10 kg = 22 lb, 15 kg = 33 lb, 20 kg = 44 lb and 25 kg = 55 lb. Only C does not fit. You can also see it on the grid: the other four points lie on a straight line through the origin, and C is below that line.

Mark scheme
  1. 1 mark

    B1 for C

  2. 1 mark

    B1 for 15 kg should be 33 lb, not 30 lb oe

    Accept \(15 \times 2.2 = 33\) with C at 30 lb, or 'C is not in a straight line with the other points (through the origin)'. A reason with no reference to C's values or position scores B0. B0 B1 is possible only if the reason clearly refers to C.

Question 3

2 marks

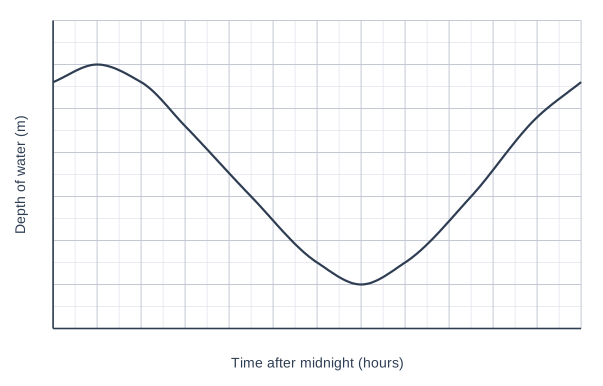
The graph shows the depth of water in a harbour between midnight and noon one day.

A fishing boat can only leave the harbour when the depth of water is at least 3 m.

For how many hours between midnight and noon could the boat not leave the harbour?

A graph of Depth of water (m) (vertical axis, 0 to 7, marked every 1) against Time after midnight (hours) (horizontal axis, 0 to 12, marked every 1), on a grid with 2 small squares to each large square. The curve is a smooth curve; its values can be read from the grid.

Model answer

The depth falls below 3 m at 4.5 hours after midnight (4:30 am).
The depth rises back to 3 m at 9.5 hours after midnight (9:30 am).
Time when the boat cannot leave = 9.5 − 4.5 = 5 hours

Explanation

Go across from 3 m on the depth axis: the line meets the curve twice, once as the tide goes out and once as it comes back in. Between these two times the depth is less than 3 m, so the boat cannot leave. Subtract the two times; a common error is to read only one of them.

Mark scheme
  1. 1 mark

    M1 for readings of 4.5 and 9.5 (hours after midnight) for a depth of 3 m

    Accept readings 4.3 to 4.7 and 9.3 to 9.7, or the times 4:30 am and 9:30 am. Or M1 for their 9.5 − their 4.5; correct answer with no working scores full marks

  2. 1 mark

    A1 for 5 (hours)

    Accept 4.6 to 5.4 from readings in range. 7 (the time of the lowest depth) scores M0 A0. A single reading only, e.g. 4.5, scores M0 A0.

Question 4

4 marks

Ellis is going on holiday to Japan.
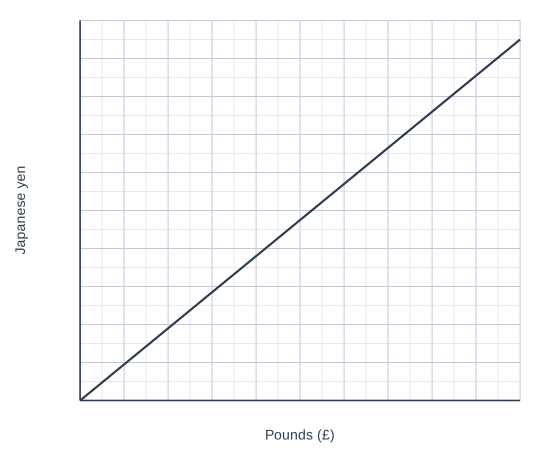
The graph can be used to convert between pounds (£) and Japanese yen.

Ellis will stay in a hotel for 4 nights.
The hotel costs 28 500 yen for each night.

Ellis has saved £580 to pay for the hotel.

Has Ellis saved enough money?
Show how you decide.

A graph of Japanese yen (vertical axis, 0 to 10000, marked every 1000) against Pounds (£) (horizontal axis, 0 to 50, marked every 5), on a grid with 2 small squares to each large square. The graph is a straight line; its values can be read from the grid.

Model answer

Cost of the hotel = \(4 \times 28\,500 = 114\,000\) yen
From the graph, £50 = 9500 yen.
\(114\,000 \div 9500 = 12\)
\(12 \times 50 = £600\)
£600 is more than £580, so Ellis has not saved enough. Ellis needs £20 more.

Explanation

The graph only goes up to £50, so read one clear pair of values and scale up: 114 000 yen is 12 lots of 9500 yen, so it is 12 lots of £50. You can also find the rate (£1 = 190 yen) and divide, or convert £580 into yen and compare. A common error is to convert the cost of only one night, or to forget to multiply by 4.

Mark scheme
  1. 1 mark

    B1 for 114 000 (yen)

    From \(4 \times 28\,500\). May be implied by later working.

  2. 1 mark

    M1 for a correct pair of values read from the graph, e.g. £50 = 9500 yen

    Accept £50 = 9400 to 9600 yen, or £1 = 190 yen, or any other correct pair, e.g. £20 = 3800 yen.

  3. 1 mark

    M1 for a complete method to compare in the same currency, e.g. \(114\,000 \div 9500 \times 50\) or \(114\,000 \div 190\) or \(580 \times 190\)

    FT their reading. Implied by £600 (or £593 to £607 from readings in range), or 110 200 yen for £580.

  4. 1 mark

    A1 for No, with £600 (or 110 200 yen) and a correct comparison

    Accept 'No, the hotel costs £600, which is £20 more than £580' or 'No, £580 is only 110 200 yen, less than 114 000 yen'. Accept values from readings in range (£593.75 to £606.38). Converting one night only: \(28\,500 \div 190 = 150\) is M1 M1 if then compared correctly, e.g. \(4 \times 150 = 600\).

Ready to try the rest? Every answer you write is marked against the mark scheme, so you can see exactly where the marks are.

Study Helper Hints first, answers after you try

Stuck on this one? Ask for a hint and I’ll point you in the right direction, without giving the answer away. Once you’ve checked your answer, I’ll show you how the marks are awarded.