Level:
Correct: 0
Incorrect: 0
Marks: 0/0
Exam Practice
Course:
Topics:
OCR GCSE Maths (Foundation calculator) Smart practice A mixed round aimed at your weak spots
Unit 1
Number Operations and Integers
Unit 2
Fractions, Decimals and Percentages
Unit 3
Indices and Surds
Unit 4
Approximation and Estimation
Unit 5
Ratio, Proportion and Rates of Change
Unit 6
Algebra
Unit 7
Graphs of Equations and Functions
Unit 8
Basic Geometry
Unit 9
Congruence and Similarity
Unit 10
Mensuration
Unit 11
Probability
Unit 12
Statistics
Avg
score:
–
Topics
done:
0/100

Charts, tables and time series graphs

Practise 18 exam-style questions on Charts, tables and time series graphs for OCR GCSE Maths (Foundation calculator). Write your answer as you would in the exam and get it marked in seconds against the mark scheme, point by point, with the Study Helper on hand if you get stuck.

  • 18 questions
  • 1–4 marks each
  • Instant marking
  • No sign-up needed
18 questions, marked as you go

Sample questions with model answers

Here are 4 of the questions in this topic, each with a model answer, an explanation of why it earns the marks and the mark scheme an examiner would use.

Question 1

2 marks

The bar chart shows the number of visitors to a museum on each day of one week.

How many more visitors were there on Saturday than on Monday?
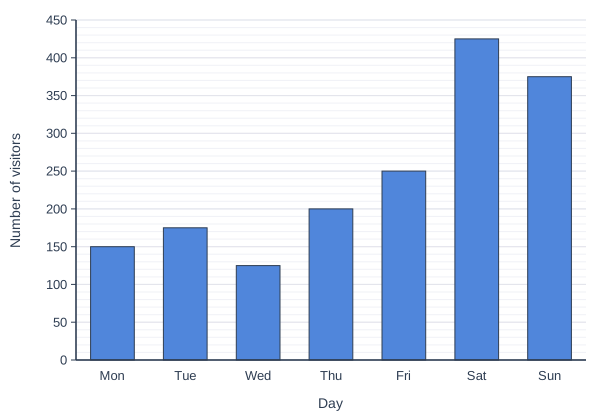
Bar chart of number of visitors for each day: Mon 150, Tue 175, Wed 125, Thu 200, Fri 250, Sat 425, Sun 375.

Model answer

Saturday: 425 visitors
Monday: 150 visitors
425 − 150 = 275 more visitors

Explanation

Read the height of each bar from the vertical scale: each gridline is 50 visitors, so a bar ending halfway between two gridlines shows a multiple of 25. Then subtract. A common error is to misread the scale on the Saturday bar.

Mark scheme
  1. 1 mark

    M1 for 425 − 150

    Or both readings, 425 (Saturday) and 150 (Monday), seen; correct answer with no working scores full marks

  2. 1 mark

    A1 for 275

    Exact readings from the chart.
Question 2

2 marks

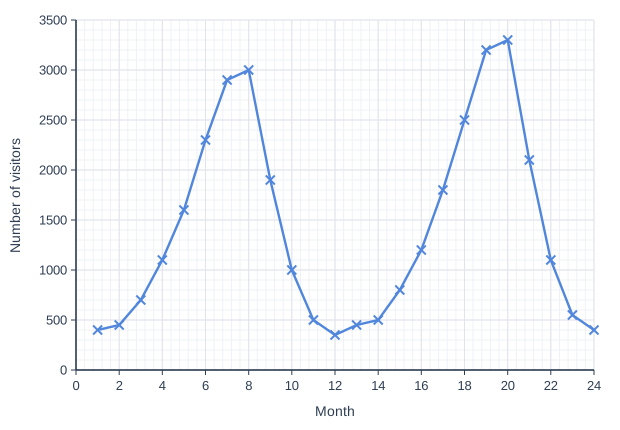
The graph shows the number of visitors to an outdoor swimming pool in each month for two years.
Month 1 is January 2024 and month 13 is January 2025.

The manager wants to close the pool for repairs for one month next year.
She wants to choose the month when the pool usually has the fewest visitors.

Which month should she choose?
Give a reason using the graph.

Line graph of number of visitors (y-axis, 0 to 3500) against month (x-axis, 0 to 24). The line joins the points (1, 400), (2, 450), (3, 700), (4, 1100), (5, 1600), (6, 2300), (7, 2900), (8, 3000), (9, 1900), (10, 1000), (11, 500), (12, 350), (13, 450), (14, 500), (15, 800), (16, 1200), (17, 1800), (18, 2500), (19, 3200), (20, 3300), (21, 2100), (22, 1100), (23, 550), (24, 400).

Model answer

December.
In both years the lowest point of the graph is in December: 350 visitors in December 2024 (month 12) and 400 visitors in December 2025 (month 24).

Explanation

The graph has a seasonal pattern: visitors rise to a peak in the summer and fall to a low point in the winter each year. The lowest month in both years is December, so this is the month when closing the pool would affect the fewest people. Using both years shows it is a regular pattern, not a one-off.

Mark scheme
  1. 1 mark

    B1 for December

    Do not accept 'month 12' or 'month 24' alone unless December is named.

  2. 1 mark

    B1 for December has the fewest visitors in both years (350 in 2024 and 400 in 2025) oe

    Accept 'the lowest point in each year is in December', 'months 12 and 24 are the lowest'. A reason using only one year scores B0.

Question 3

2 marks

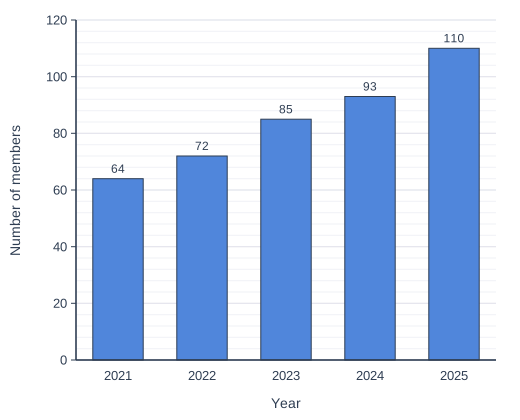
The bar chart shows the number of members of a climbing club in each year from 2021 to 2025.

Work out the percentage increase in the number of members from 2021 to 2025.
Give your answer correct to 1 decimal place.

Bar chart of number of members for each year: 2021 64, 2022 72, 2023 85, 2024 93, 2025 110.

Model answer

Members in 2021: 64
Members in 2025: 110
Increase = 110 − 64 = 46
Percentage increase = \(\dfrac{46}{64} \times 100 = 71.875\)
= 71.9% to 1 decimal place

Explanation

Percentage increase = increase ÷ original value × 100, and the original value is the earlier year, 2021. A common error is to divide by the later value, 110.

Mark scheme
  1. 1 mark

    M1 for \(\dfrac{110 - 64}{64}\) (\(\times 100\)) oe

    Or \(\dfrac{110}{64} \times 100 - 100\). Implied by 0.71875 or 171.875; correct answer with no working scores full marks

  2. 1 mark

    A1 for 71.9(%)

    Accept 71.87 to 71.9 (exact value 71.875). 41.8 (from \(46 \div 110\)) scores M0 A0. 171.9 scores M1 A0.

Question 4

3 marks

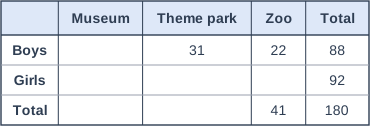
180 students in Year 10 each chose one place to visit on a trip: the museum, the theme park or the zoo.

The two-way table shows some information about their choices.

35% of the students chose the museum.

How many girls chose the museum?

Table with columns (row headings), "Museum", "Theme park", "Zoo", "Total". Boys; Museum: (blank); Theme park: 31; Zoo: 22; Total: 88 | Girls; Museum: (blank); Theme park: (blank); Zoo: (blank); Total: 92 | Total; Museum: (blank); Theme park: (blank); Zoo: 41; Total: 180.

Model answer

Students who chose the museum = \(0.35 \times 180 = 63\)
Boys who chose the museum = 88 − 31 − 22 = 35
Girls who chose the museum = 63 − 35 = 28

Explanation

Use the percentage to find the total for the museum column, and use the boys' row to find how many boys chose the museum. The girls are the rest of the museum column. Checking that rows and columns add up to their totals helps to avoid mistakes.

Mark scheme
  1. 1 mark

    B1 for 63 (students who chose the museum)

    From \(0.35 \times 180\); correct answer with no working scores full marks

  2. 1 mark

    M1 for 88 − 31 − 22

    Implied by 35 (boys who chose the museum).

  3. 1 mark

    A1 for 28

    FT their 63 − 35 only if B1 and M1 are both earned. 35 (boys) as the final answer scores B1 M1 A0. Exact values from the question.

Ready to try the rest? Every answer you write is marked against the mark scheme, so you can see exactly where the marks are.

Study Helper Hints first, answers after you try

Stuck on this one? Ask for a hint and I’ll point you in the right direction, without giving the answer away. Once you’ve checked your answer, I’ll show you how the marks are awarded.