Level:
Correct: 0
Incorrect: 0
Marks: 0/0
Exam Practice
Course:
Topics:
OCR GCSE Maths (Foundation calculator) Smart practice A mixed round aimed at your weak spots
Unit 1
Number Operations and Integers
Unit 2
Fractions, Decimals and Percentages
Unit 3
Indices and Surds
Unit 4
Approximation and Estimation
Unit 5
Ratio, Proportion and Rates of Change
Unit 6
Algebra
Unit 7
Graphs of Equations and Functions
Unit 8
Basic Geometry
Unit 9
Congruence and Similarity
Unit 10
Mensuration
Unit 11
Probability
Unit 12
Statistics
Avg
score:
–
Topics
done:
0/100

Gradients and rates of change

Practise 14 exam-style questions on Gradients and rates of change for OCR GCSE Maths (Foundation calculator). Write your answer as you would in the exam and get it marked in seconds against the mark scheme, point by point, with the Study Helper on hand if you get stuck.

  • 14 questions
  • 1–4 marks each
  • Instant marking
  • No sign-up needed
14 questions, marked as you go

Sample questions with model answers

Here are 4 of the questions in this topic, each with a model answer, an explanation of why it earns the marks and the mark scheme an examiner would use.

Question 1

1 mark

The graph shows a car journey.
The journey has four sections, labelled on the graph:
A (0 to 0.5 hours), B (0.5 to 1 hour), C (1 to 1.5 hours) and D (1.5 to 2.5 hours).

In which section was the car travelling at its fastest speed?
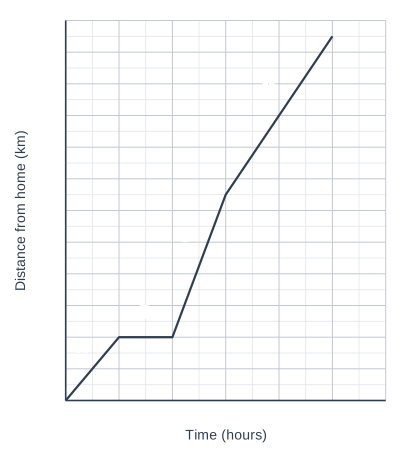
A graph of Distance from home (km) (vertical axis, 0 to 120, marked every 10) against Time (hours) (horizontal axis, 0 to 3, marked every 0.5), on a grid with 2 small squares to each large square. The graph is made of straight-line sections joining (0, 0), (0.5, 20), (1, 20), (1.5, 65) and (2.5, 115). Point A is marked at (0.15, 17). Point B is marked at (0.75, 28). Point C is marked at (1.12, 52). Point D is marked at (1.9, 100).

Model answer

C
The line is steepest in section C, so the distance changes fastest there.

Explanation

On a distance-time graph the gradient is the speed, so the steepest section is the fastest. Section C goes up 45 km in half an hour (90 km/h), steeper than A (40 km/h) and D (50 km/h), and B is horizontal, so the car is stopped. A common error is to choose the section that reaches the greatest distance.

Mark scheme
  1. 1 mark

    B1 for C

    Section C has the steepest line: 45 km in 0.5 hours, 90 km/h. Do not accept D (the section where the car is furthest away).
Question 2

2 marks

A printer prints pages at a constant rate.

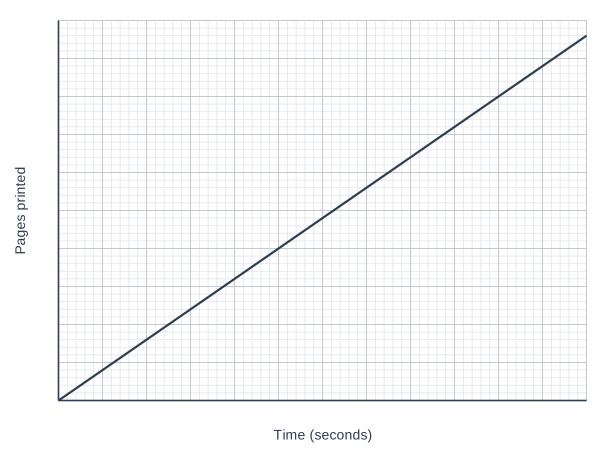
The graph shows the number of pages printed.

Work out the rate at which the printer prints, in pages per minute.

A graph of Pages printed (vertical axis, 0 to 50, marked every 5) against Time (seconds) (horizontal axis, 0 to 120, marked every 10), on a grid with 5 small squares to each large square. The graph is a straight line; its values can be read from the grid.

Model answer

From the graph, the printer prints 24 pages in 60 seconds.
60 seconds = 1 minute
Rate = 24 pages per minute

Explanation

The time axis is in seconds, so the gradient of the line (0.4 pages each second) is a rate in pages per second. To get pages per minute, read the number of pages at 60 seconds, or multiply the rate per second by 60. A common error is to give the rate per second.

Mark scheme
  1. 1 mark

    M1 for a correct pair of readings and a method to change to minutes, e.g. 24 pages in 60 seconds, or \(48 \div 2\), or \(12 \div 30 \times 60\)

    Or M1 for 0.4 (pages per second) seen; correct answer with no working scores full marks

  2. 1 mark

    A1 for 24

    Exact value: no rounding needed. 0.4 (pages per second) as the final answer scores M1 A0.

Question 3

2 marks

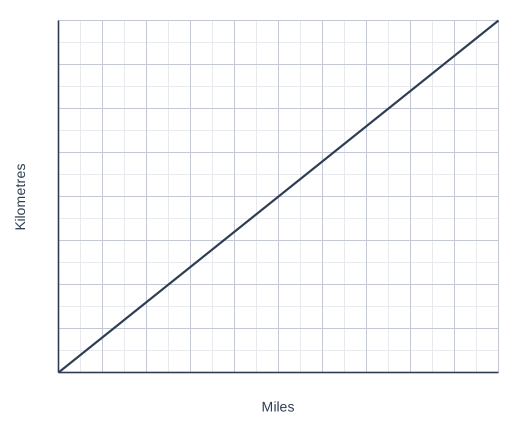
The graph can be used to convert between miles and kilometres.

Sam works out the gradient of the line.
Here is his working.

Gradient = \(50 \div 80 = 0.625\)

Explain the mistake Sam has made.
Work out the correct gradient.

A graph of Kilometres (vertical axis, 0 to 80, marked every 10) against Miles (horizontal axis, 0 to 50, marked every 5), on a grid with 2 small squares to each large square. The graph is a straight line joining (0, 0) and (50, 80).

Model answer

Sam has divided the change in miles (across) by the change in kilometres (up).
The gradient is the vertical change divided by the horizontal change.
Gradient = \(80 \div 50 = 1.6\)

Explanation

Gradient = change in the vertical direction ÷ change in the horizontal direction. Kilometres are on the vertical axis and miles on the horizontal axis, so the gradient is 80 ÷ 50 = 1.6: it shows that 1 mile is 1.6 km. Sam's 0.625 is the number of miles in 1 km, which is not the gradient of this graph.

Mark scheme
  1. 1 mark

    B1 for he has divided the horizontal change by the vertical change oe

    Accept 'he has done across ÷ up instead of up ÷ across', 'he has divided the miles by the kilometres', 'it should be 80 ÷ 50', 'he has the division the wrong way round'. Do not accept 'he has used the wrong numbers'.

  2. 1 mark

    B1 for 1.6

    Accept \(\dfrac{8}{5}\) oe. Exact value: no rounding needed.

Question 4

4 marks

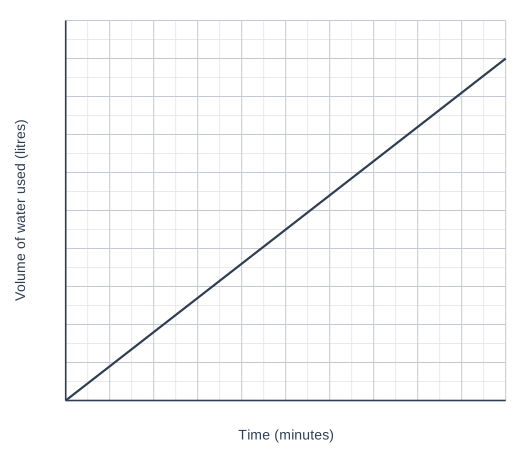
Mia's shower uses water at a constant rate.

The graph shows the volume of water used by the shower.

Mia has one 8-minute shower every day.
Water costs £3.20 for each cubic metre (m³).
1 m³ = 1000 litres.

Work out the cost of the water for Mia's showers in one year of 365 days.
Give your answer to the nearest penny.

A graph of Volume of water used (litres) (vertical axis, 0 to 100, marked every 10) against Time (minutes) (horizontal axis, 0 to 10, marked every 1), on a grid with 2 small squares to each large square. The graph is a straight line; its values can be read from the grid.

Model answer

From the graph, the shower uses 90 litres in 10 minutes.
Rate = \(90 \div 10 = 9\) litres per minute
One shower = \(9 \times 8 = 72\) litres
One year = \(72 \times 365 = 26\,280\) litres = 26.28 m³
Cost = \(26.28 \times 3.20 = 84.096\)
Cost = £84.10 to the nearest penny

Explanation

The gradient of the graph is the rate of flow: 9 litres every minute. Use it to find the water for one 8-minute shower, then for 365 showers, and change litres into cubic metres by dividing by 1000 before multiplying by the price. A common error is to forget to change litres into cubic metres.

Mark scheme
  1. 1 mark

    M1 for 9 (litres per minute) or 72 (litres per shower) from the graph

    e.g. \(90 \div 10\) or \(45 \div 5\), or 72 read at 8 minutes; correct answer with no working scores full marks

  2. 1 mark

    M1 for their \(72 \times 365\)

    Implied by 26 280 (litres). Or their 9 × 8 × 365 oe.

  3. 1 mark

    M1 for their \(26\,280 \div 1000 \times 3.20\) oe

    Implied by 26.28 (m³) multiplied by 3.20, or 84.096. Exact values from the question and graph.

  4. 1 mark

    A1 for £84.10

    Accept 84.096 to 84.1 (calculator value 84.096). 84.09 (truncated) scores M1 M1 M1 A0. 84 096 or 84 096 pounds (not dividing by 1000) scores M1 M1 M0 A0.

Ready to try the rest? Every answer you write is marked against the mark scheme, so you can see exactly where the marks are.

Study Helper Hints first, answers after you try

Stuck on this one? Ask for a hint and I’ll point you in the right direction, without giving the answer away. Once you’ve checked your answer, I’ll show you how the marks are awarded.