Level:
Correct: 0
Incorrect: 0
Marks: 0/0
Exam Practice
Subject:
Topics:
Edexcel GCSE Maths (Calculator) Smart practice A mixed round aimed at your weak spots
Unit 1
Number
Unit 2
Algebra
Unit 3
Ratio, proportion and rates of change
Unit 4
Geometry and measures
Unit 5
Probability
Unit 6
Statistics
Avg
score:
–
Topics
done:
0/97

Scatter graphs and correlation

Practise 28 exam-style questions on Scatter graphs and correlation for Edexcel GCSE Maths (Calculator). Write your answer as you would in the exam and get it marked in seconds against the mark scheme, point by point, with an AI tutor on hand if you get stuck.

  • 28 questions
  • 1–5 marks each
  • Instant marking
  • No sign-up needed
20 questions, marked as you go

Sample questions with model answers

Here are 4 of the questions in this topic, each with a model answer, an explanation of why it earns the marks and the mark scheme an examiner would use.

Question 1

1 mark

The scatter graph shows the maths mark and the science mark of each of 14 students.

One of the students has results that do not fit the pattern of the others.

Write down the maths mark and the science mark of this student.
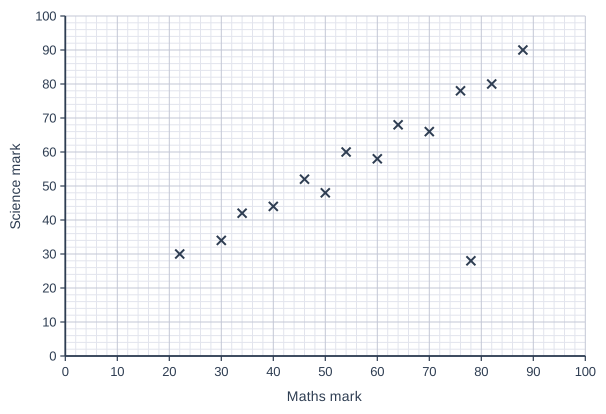
Scatter graph on a grid of small squares. The horizontal axis is "Maths mark", from 0 to 100, numbered every 10, with 5 small squares between numbered values (each small square is 2). The vertical axis is "Science mark", from 0 to 100, numbered every 10, with 5 small squares between numbered values (each small square is 2). 14 points are plotted as crosses: (22, 30), (30, 34), (34, 42), (40, 44), (46, 52), (50, 48), (54, 60), (60, 58), (64, 68), (70, 66), (76, 78), (82, 80), (88, 90) and (78, 28).

Model answer

Maths mark 78, science mark 28 - the point (78, 28) is well below the pattern of the other points.

Explanation

The other points show positive correlation: students with high maths marks also have high science marks. The student at (78, 28) has a high maths mark but a very low science mark, so this point is an outlier.

Mark scheme
  1. 1 mark

    B1 for maths 78 and science 28

    accept (78, 28)
Question 2

2 marks

A scatter graph shows strong negative correlation between two variables, x and y.
The points go from about (0, 80) down to about (10, 20).

Which of these could be the equation of the line of best fit?

A: y = 6x + 20
B: y = −6x + 80
C: y = −0.6x + 80
D: y = 80x − 6

Give a reason for your answer.

Model answer

B: y = −6x + 80.
Negative correlation needs a negative gradient, which rules out A and D. The gradient should be about \(\frac{20 - 80}{10 - 0} = -6\), and the line should cross the y-axis near 80. For C, when x = 10, y = 74, which is far from 20.

Explanation

In y = mx + c, m is the gradient and c is the y-intercept. Negative correlation means a negative gradient; then check the size of the gradient and the intercept against the data, e.g. by substituting x = 10.

Mark scheme
  1. 1 mark

    B1 for B

  2. 1 mark

    C1 for a reason, e.g. the gradient must be negative and about (20 − 80) ÷ 10 = −6, with the line crossing the y-axis at about 80; C is negative but too shallow (it gives y = 74 at x = 10)

    oe

Question 3

3 marks

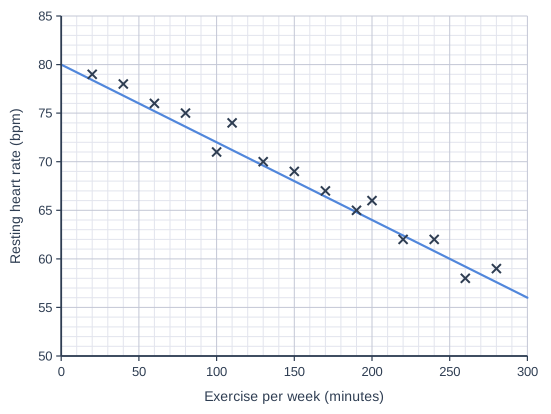
The scatter graph shows the number of minutes of exercise per week and the resting heart rate of 15 adults.
A line of best fit has been drawn.

Ana wants to reduce her resting heart rate to 60 bpm.
She will exercise for the same amount of time every day.

Use the line of best fit to estimate how many minutes of exercise Ana should do each day.

Scatter graph on a grid of small squares. The horizontal axis is "Exercise per week (minutes)", from 0 to 300, numbered every 50, with 5 small squares between numbered values (each small square is 10). The vertical axis is "Resting heart rate (bpm)", from 50 to 85, numbered every 5, with 5 small squares between numbered values (each small square is 1). 15 points are plotted as crosses: (20, 79), (40, 78), (60, 76), (80, 75), (100, 71), (110, 74), (130, 70), (150, 69), (170, 67), (190, 65), (200, 66), (220, 62), (240, 62), (260, 58) and (280, 59). A straight line of best fit is drawn; it passes through (0, 80) and (300, 56).

Model answer

Across from 60 bpm to the line of best fit and down: about 250 minutes per week.
Per day: \(250 \div 7 = 35.7...\)
About 36 minutes each day.

Explanation

Start on the heart rate axis at 60, go across to the line and down to read the minutes per week. The graph is per week, so divide by 7 for a daily amount. This assumes the relationship is causal for Ana, which a scatter graph alone cannot prove.

Mark scheme
  1. 1 mark

    P1 for reading across from 60 bpm to the line: about 250 minutes per week

    accept 240 to 260; correct answer with no working scores full marks

  2. 1 mark

    P1 for dividing their reading by 7

  3. 1 mark

    A1 for about 36 minutes

    accept 34 to 37 (from 240 to 260 minutes per week)

Question 4

4 marks

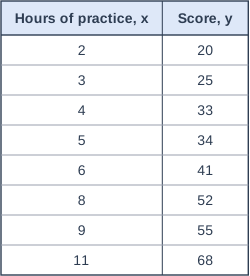
The table shows the number of hours, x, that 8 people practised for a typing test and their scores, y.

Tom draws a line of best fit that passes through the mean point (\(\bar{x}\), \(\bar{y}\)) and the point (0, 12).

Use Tom's line of best fit to estimate the score of a person who practised for 7.5 hours.

Table with columns "Hours of practice, x", "Score, y". Hours of practice, x: 2; Score, y: 20 | Hours of practice, x: 3; Score, y: 25 | Hours of practice, x: 4; Score, y: 33 | Hours of practice, x: 5; Score, y: 34 | Hours of practice, x: 6; Score, y: 41 | Hours of practice, x: 8; Score, y: 52 | Hours of practice, x: 9; Score, y: 55 | Hours of practice, x: 11; Score, y: 68.

Model answer

Mean of x = (2 + 3 + 4 + 5 + 6 + 8 + 9 + 11) ÷ 8 = 48 ÷ 8 = 6
Mean of y = (20 + 25 + 33 + 34 + 41 + 52 + 55 + 68) ÷ 8 = 328 ÷ 8 = 41
Gradient of the line through (0, 12) and (6, 41) = \(\frac{29}{6} = 4.833...\)
Equation: \(y = 4.833...x + 12\)
At x = 7.5: \(y = 4.833... \times 7.5 + 12 = 36.25 + 12 = 48.25\)
Estimated score ≈ 48

Explanation

A good line of best fit passes through the mean point of the data. Find the mean of each variable, then the gradient of the line through (6, 41) and (0, 12), and substitute x = 7.5. 7.5 hours is within the data range, so this is interpolation and is reasonably reliable.

Mark scheme
  1. 1 mark

    M1 for the mean of x, \(48 \div 8 = 6\)

    correct answer with no working scores full marks

  2. 1 mark

    M1 for the mean of y, \(328 \div 8 = 41\)

  3. 1 mark

    M1 for the gradient of the line through (0, 12) and (6, 41), \(\frac{41 - 12}{6}\) (= 4.83...), or the equation y = 4.83...x + 12

    ft their mean point

  4. 1 mark

    A1 for 48.25

    accept 48.2 or 48.3

Ready to try the rest? Every answer you write is marked against the mark scheme, so you can see exactly where the marks are.

AI Tutor Hints first, answers after you try

Hi! Stuck? Ask me for a hint and I’ll help you work it out. Once you’ve checked your answer I can explain exactly where the marks are.