Practise 30 exam-style questions on Gradient as a rate of change for Edexcel GCSE Maths (Calculator). Write your answer as you would in the exam and get it marked in seconds against the mark scheme, point by point, with an AI tutor on hand if you get stuck.
30 questions
1–5 marks each
Instant marking
No sign-up needed
20 questions, marked as you go
Sample questions with model answers
Here are 4 of the questions in this topic, each with a model answer, an explanation of why it earns the marks and the mark scheme an examiner would use.
Question 1
1 mark
y is directly proportional to x. The graph of y against x is a straight line.
Write down the coordinates of a point that the line must pass through.
Model answer
(0, 0) - the graph of direct proportion always passes through the origin.
Explanation
Direct proportion means y = kx, so when x = 0, y = k × 0 = 0. Every direct proportion graph is a straight line through the origin, and its gradient is the constant of proportionality k.
Mark scheme
1 mark
B1 for (0, 0)
cao; accept "the origin"
Question 2
3 marks
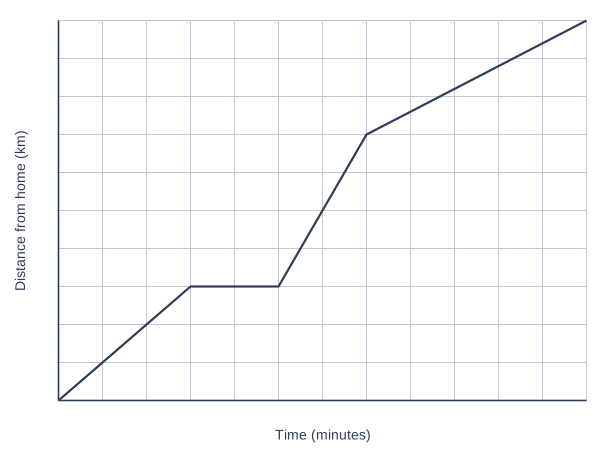
Jo drives from her home to a garden centre. The travel graph shows her journey.
In which part of the journey was Jo travelling fastest? Work out her speed, in km/h, for that part of the journey.
Model answer
0 to 15 minutes: 6 km in 15 minutes = 0.4 km per minute 25 to 35 minutes: 8 km in 10 minutes = 0.8 km per minute 35 to 60 minutes: 6 km in 25 minutes = 0.24 km per minute She was fastest from 25 to 35 minutes (the steepest section). Speed = 0.8 × 60 = 48 km/h
Explanation
The steepest section of a distance-time graph has the greatest gradient, which means the greatest speed. Work out each gradient to be sure, then change km per minute into km per hour by multiplying by 60. The flat section is when Jo had stopped.
Mark scheme
1 mark
M1 for working out or comparing the gradients of at least two moving sections, e.g. 6 ÷ 15 (= 0.4 km per minute) and 8 ÷ 10 (= 0.8 km per minute)
oe; correct answer with no working scores full marks
1 mark
M1 for 8 ÷ 10 × 60
oe
1 mark
A1 for 48 km/h, from 25 to 35 minutes
cao
Question 3
3 marks
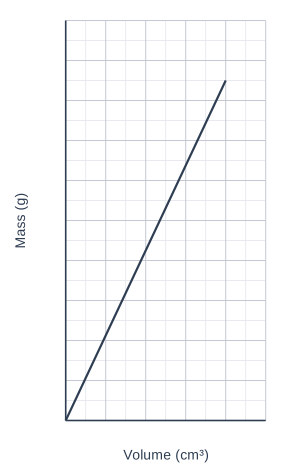
The graph shows the mass and the volume of pieces of brass.
Work out the gradient of the line and state what it represents. Use your answer to find the mass of a piece of brass with a volume of 250 cm³.
Model answer
The line passes through (0, 0) and (20, 170). Gradient = 170 ÷ 20 = 8.5 The gradient is the mass of each cm³, which is the density of brass: 8.5 g/cm³. Mass of 250 cm³ = 8.5 × 250 = 2125 g
Explanation
The gradient is mass ÷ volume, which is exactly the definition of density, so its units are g/cm³. Because the graph is a straight line through the origin, mass is directly proportional to volume, so mass = 8.5 × volume for any piece of brass.
Mark scheme
1 mark
M1 for a method to find the gradient, e.g. 170 ÷ 20
oe; correct answer with no working scores full marks
1 mark
A1 for 8.5, with the density of brass (8.5 g/cm³, or grams per cm³)
cao
1 mark
B1 for 2125 g
ft 250 × their gradient
Question 4
5 marks
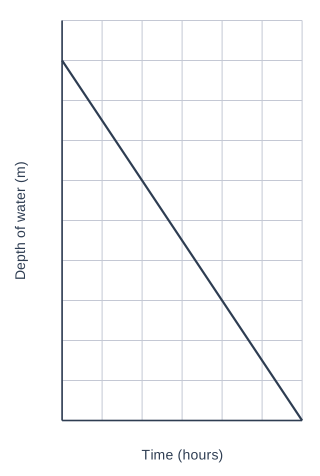
A swimming pool is a cuboid, 25 m long and 10 m wide. Water is pumped out of the pool at a constant rate. The graph shows the depth of the water in the pool.
1 m³ = 1000 litres
Work out the rate at which water is pumped out of the pool, in litres per minute.
Model answer
From the graph, the depth falls from 1.8 m to 0 m in 6 hours. Rate of decrease of depth = 1.8 ÷ 6 = 0.3 m per hour Volume pumped out each hour = 25 × 10 × 0.3 = 75 m³ 75 m³ = 75 000 litres 75 000 ÷ 60 = 1250 litres per minute
Explanation
The gradient of the depth-time graph gives the depth lost each hour. Multiplying by the area of the surface turns this into a volume each hour. Then change m³ to litres (× 1000) and hours to minutes (÷ 60).
Mark scheme
1 mark
P1 for the rate of decrease of depth, 1.8 ÷ 6 (= 0.3 m per hour)
oe; correct answer with no working scores full marks
1 mark
P1 for the area of the surface, 25 × 10 (= 250 m²)
1 mark
P1 for 250 × 0.3 (= 75 m³ per hour), or the total volume 25 × 10 × 1.8 (= 450 m³) ÷ 6
oe
1 mark
P1 for converting to litres per minute, e.g. 75 × 1000 ÷ 60
oe
1 mark
A1 for 1250 litres per minute
cao
Ready to try the rest? Every answer you write is marked against the mark scheme, so you can see exactly where the marks are.
Ctrl + Enter to check
AI TutorHints first, answers after you try
Hi! Stuck? Ask me for a hint and I’ll help you work it out. Once you’ve checked your answer I can explain exactly where the marks are.