
Level:
Correct: 0
Incorrect: 0
Marks: 0/0
Exam Practice
Subject:
Topics:
Edexcel GCSE Maths (Calculator) Smart practice A mixed round aimed at your weak spots
Unit 1
Number
Unit 2
Algebra
Unit 3
Ratio, proportion and rates of change
Unit 4
Geometry and measures
Unit 5
Probability
Unit 6
Statistics
Avg
score:
–
Topics
done:
0/97

Gradients and areas under graphs

Practise 29 exam-style questions on Gradients and areas under graphs for Edexcel GCSE Maths (Calculator). Write your answer as you would in the exam and get it marked in seconds against the mark scheme, point by point, with an AI tutor on hand if you get stuck.

  • 29 questions
  • 1–5 marks each
  • Instant marking
  • No sign-up needed
20 questions, marked as you go

Sample questions with model answers

Here are 4 of the questions in this topic, each with a model answer, an explanation of why it earns the marks and the mark scheme an examiner would use.

Question 1

2 marks

The graph shows the velocity of a bus as it leaves a bus stop.

Work out the acceleration of the bus during the first 12 seconds.
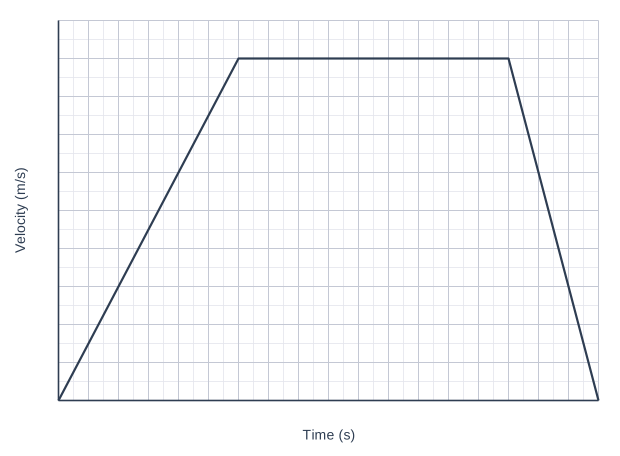
A graph of Velocity (m/s) (vertical axis, 0 to 10, marked every 1) against Time (s) (horizontal axis, 0 to 36, marked every 2), on a grid with 2 small squares to each large square. The graph is made of straight-line sections; its values can be read from the grid.

Model answer

Acceleration = gradient of the first section
\(= \dfrac{9 - 0}{12 - 0} = 0.75\) m/s²

Explanation

Acceleration is the gradient of a velocity-time graph: the increase in velocity divided by the time taken. Here the velocity goes up by 9 m/s in 12 seconds. A common mistake is to divide the wrong way round, 12 ÷ 9.

Mark scheme
  1. 1 mark

    M1 for \(\dfrac{9}{12}\)

    oe; gradient of the first section

  2. 1 mark

    A1 for 0.75 m/s²

    cao; correct answer with no working scores full marks
Question 2

2 marks

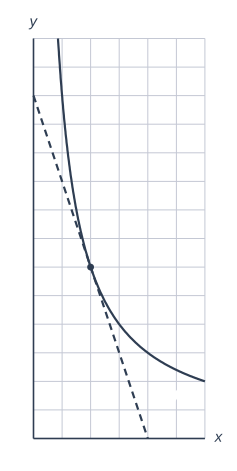
The diagram shows part of the curve \(y = \dfrac{12}{x}\) and the tangent to the curve at the point P(2, 6).

Use the tangent to find the gradient of the curve at P.

A coordinate grid with x from 0 to 6 and y from 0 to 14; each grid square is 1 unit across, and the axes cross at the origin O. The curve labelled "y = 12/x" is a curve: it gets closer and closer to the line y = 0 (the x-axis) at both ends without reaching it. The dashed tangent is a straight line touching the curve labelled "y = 12/x" at (2, 6), drawn from x = 0 to x = 4 crossing the y-axis at (0, 12) and crossing the x-axis at (4, 0). Point P is marked with a dot at (2, 6).

Model answer

The tangent passes through (0, 12) and (4, 0).
Gradient \(= \dfrac{0 - 12}{4 - 0} = -3\)
The gradient of the curve at P is −3.

Explanation

The gradient of a curve at a point is the gradient of the tangent there. The tangent slopes downwards, so the gradient is negative. Read two points where the tangent crosses grid lines exactly, such as where it meets the axes.

Mark scheme
  1. 1 mark

    M1 for using two points on the tangent, e.g. (0, 12) and (4, 0)

  2. 1 mark

    A1 for −3

    cao; correct answer with no working scores full marks
Question 3

3 marks

A car starts from rest and accelerates at a constant rate for 8 seconds until it reaches a speed of V m/s.
It travels at V m/s for 20 seconds.
It then decelerates at a constant rate and stops 6 seconds later.
The car travels a total distance of 650 m.

Work out the value of V.
Give your answer correct to 3 significant figures.

Model answer

The velocity-time graph is a trapezium with parallel sides 20 s and 8 + 20 + 6 = 34 s, and height V.
Distance \(= \frac{1}{2}(20 + 34) \times V = 27V\)
27V = 650
V = 650 ÷ 27 = 24.074...
V = 24.1 (3 s.f.)

Explanation

Sketch the velocity-time graph: up for 8 s, flat for 20 s, down for 6 s. The distance is the area under it, a trapezium of height V, so the area is a multiple of V. Set it equal to 650 and solve. A common error is to use 34 for both parallel sides.

Mark scheme
  1. 1 mark

    P1 for an expression for the area under the velocity-time graph, e.g. \(\frac{1}{2} \times 8 \times V + 20V + \frac{1}{2} \times 6 \times V\)

    oe, e.g. \(\frac{1}{2}(20 + 34)V\)

  2. 1 mark

    P1 for 27V = 650

    oe

  3. 1 mark

    A1 for 24.1

    awrt 24.1 (24.07...); correct answer with no working scores full marks

Question 4

4 marks

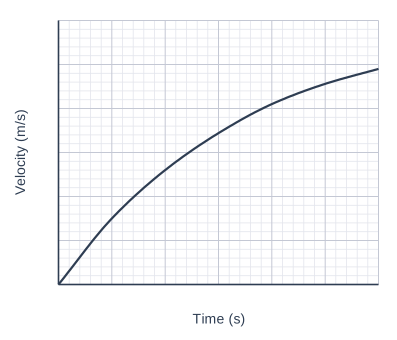
The graph shows the velocity of a car during the first 6 seconds after it starts to move.

Ali says, "The car travels more than 85 metres in the first 6 seconds."

Use 3 strips of equal width to show that Ali is correct.
You must explain your reasoning.

A graph of Velocity (m/s) (vertical axis, 0 to 30, marked every 5) against Time (s) (horizontal axis, 0 to 6, marked every 1), on a grid with 5 small squares to each large square. The curve is a smooth curve; its values can be read from the grid.

Model answer

Velocities at t = 0, 2, 4, 6: 0, 13, 20.5, 24.5
Strips of width 2:
\(\frac{1}{2}(0 + 13) \times 2 = 13\)
\(\frac{1}{2}(13 + 20.5) \times 2 = 33.5\)
\(\frac{1}{2}(20.5 + 24.5) \times 2 = 45\)
Estimate = 13 + 33.5 + 45 = 91.5 m
The curve bends downwards, so it lies above the tops of the trapezia: 91.5 m is an underestimate.
The true distance is more than 91.5 m, so it is more than 85 m. Ali is correct.

Explanation

The trapezium estimate of the area under a velocity-time graph gives the distance. On its own, an estimate cannot prove a claim, but here the curve bulges above the chords, so the true area is even bigger than 91.5. That is why the explanation must say the estimate is an underestimate.

Mark scheme
  1. 1 mark

    M1 for reading the velocities at t = 0, 2, 4, 6: 0, 13, 20.5, 24.5

    at least 3 correct; accept readings within 0.2

  2. 1 mark

    M1 for a correct method for the total area of the 3 trapezia, e.g. \(\frac{1}{2} \times 2 \times (0 + 2(13 + 20.5) + 24.5)\)

    ft their readings

  3. 1 mark

    A1 for 91.5 m

    accept 90 to 93

  4. 1 mark

    C1 for a complete argument: the estimate is more than 85 and it is an underestimate (the curve is above the tops of the trapezia), so the true distance is more than 85 m

    must mention underestimate (or the curve bending downwards)

Ready to try the rest? Every answer you write is marked against the mark scheme, so you can see exactly where the marks are.

AI Tutor Hints first, answers after you try

Hi! Stuck? Ask me for a hint and I’ll help you work it out. Once you’ve checked your answer I can explain exactly where the marks are.