Level:
Correct: 0
Incorrect: 0
Marks: 0/0
Exam Practice
Subject:
Topics:
Edexcel GCSE Maths (Calculator) Smart practice A mixed round aimed at your weak spots
Unit 1
Number
Unit 2
Algebra
Unit 3
Ratio, proportion and rates of change
Unit 4
Geometry and measures
Unit 5
Probability
Unit 6
Statistics
Avg
score:
–
Topics
done:
0/97

Real-life and non-standard graphs

Practise 28 exam-style questions on Real-life and non-standard graphs for Edexcel GCSE Maths (Calculator). Write your answer as you would in the exam and get it marked in seconds against the mark scheme, point by point, with an AI tutor on hand if you get stuck.

  • 28 questions
  • 1–5 marks each
  • Instant marking
  • No sign-up needed
20 questions, marked as you go

Sample questions with model answers

Here are 4 of the questions in this topic, each with a model answer, an explanation of why it earns the marks and the mark scheme an examiner would use.

Question 1

2 marks

Amir walked from village A to village B, 5 km away.
Bella cycled from village B to village A along the same road.
The graph shows their journeys.

Use the graph to find the time when they passed each other and their distance from village A at that time.
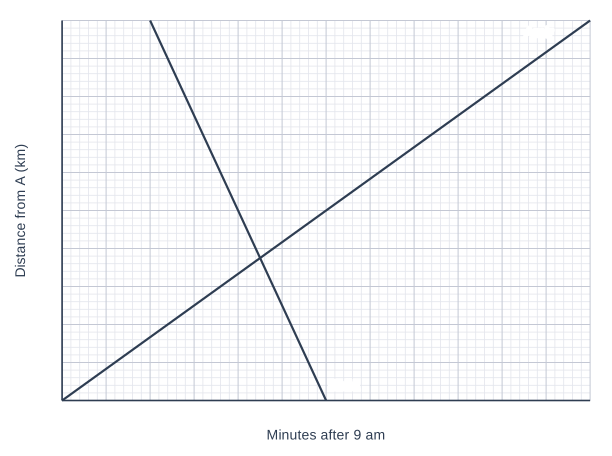
A graph of Distance from A (km) (vertical axis, 0 to 5, marked every 0.5) against Minutes after 9 am (horizontal axis, 0 to 60, marked every 5), on a grid with 5 small squares to each large square. The graph labelled "Amir" is a straight line joining (0, 0) and (60, 5). The graph labelled "Bella" is a straight line joining (10, 5) and (30, 0). The graph labelled "Amir" and the graph labelled "Bella" cross at one point, which can be read from the grid.

Model answer

They pass each other where the two lines cross.
Reading from the graph: about 22.5 minutes after 9 am, at about 1.9 km from A.
They passed each other at about 9:22 am, about 1.9 km from village A.

Explanation

When two people are at the same place at the same time, their lines on a distance-time graph cross. Read the time across the bottom and the distance up the side from the crossing point, using the small squares (1 minute and 0.1 km). Remember the time axis counts minutes after 9 am.

Mark scheme
  1. 1 mark

    B1 for a time from 9:22 am to 9:23 am

    accept 22 to 23 minutes after 9 am (exact 22.5 minutes); correct answer with no working scores full marks

  2. 1 mark

    B1 for a distance from 1.8 km to 2.0 km

    exact 1.875 km

Question 2

2 marks

The number of bacteria, N, in a culture t hours after the start of an experiment is modelled by \(N = 500 \times 1.6^t\)
The table shows some values of N.

Find the values of a and b.
Give b to the nearest whole number.

Table with columns "t (hours)", "0", "1", "2", "3", "4", "5". t (hours): N; 0: 500; 1: 800; 2: a; 3: 2048; 4: 3277; 5: b.

Model answer

\(a = 500 \times 1.6^2 = 500 \times 2.56 = 1280\)
\(b = 500 \times 1.6^5 = 500 \times 10.48576 = 5242.88\), so b = 5243

Explanation

Substitute each value of t into the formula, working out the power first and then multiplying by 500. Check with the table: each value is 1.6 times the one before (800 × 1.6 = 1280). The graph of N against t would be an exponential curve, getting steeper as t increases.

Mark scheme
  1. 1 mark

    B1 for a = 1280

    cao; correct answer with no working scores full marks

  2. 1 mark

    B1 for b = 5243

    accept 5242.88 or 5242

Question 3

3 marks

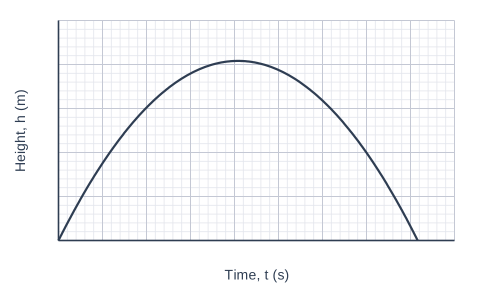
A ball is thrown upwards from the ground.
Its height, h metres, t seconds after it is thrown is modelled by \(h = 20t - 4.9t^2\)
The graph shows h against t.

Use the graph to estimate the length of time for which the ball is more than 15 m above the ground.

A graph of Height, h (m) (vertical axis, 0 to 25, marked every 5) against Time, t (s) (horizontal axis, 0 to 4.5, marked every 0.5), on a grid with 5 small squares to each large square. The curve is an upside-down U-shaped (∩-shaped) parabola; its key points can be read from the grid.

Model answer

Reading across from h = 15, the curve crosses at t ≈ 1.0 s (going up) and t ≈ 3.1 s (coming down).
The ball is above 15 m between these times.
3.1 − 1.0 = 2.1 seconds

Explanation

The ball is higher than 15 m while the curve is above the horizontal line h = 15. Read the two times where the curve crosses this line and subtract. You could check by solving \(4.9t^2 - 20t + 15 = 0\) with the quadratic formula, which gives 0.990 and 3.091.

Mark scheme
  1. 1 mark

    M1 for reading across from h = 15 to the curve

    or solving \(20t - 4.9t^2 = 15\); correct answer with no working scores full marks

  2. 1 mark

    A1 for both times, from 0.9 to 1.1 and from 3.0 to 3.2 seconds

    exact 0.990... and 3.091...

  3. 1 mark

    A1 for an answer from 1.9 to 2.3 seconds

    ft their times; exact 2.10...

Question 4

4 marks

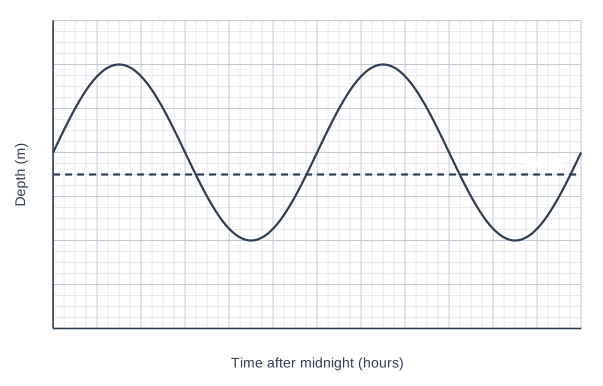
The depth of water, d metres, in a harbour t hours after midnight is modelled by d = 4 + 2 sin(30t)°
The graph shows d for one day.

A boat can only use the harbour when the depth of water is at least 3.5 m.

Use the graph to estimate the total time during the day when the boat cannot use the harbour.

A graph of Depth (m) (vertical axis, 0 to 7, marked every 1) against Time after midnight (hours) (horizontal axis, 0 to 24, marked every 2), on a grid with 4 small squares to each large square. The curve is a sine curve (a smooth repeating wave); its key points can be read from the grid. The line labelled "3.5 m" is a horizontal straight line crossing the y-axis at (0, 3.5) (the line y = 3.5). The curve and the line labelled "3.5 m" cross at 4 points, which can be read from the grid.

Model answer

The curve is below d = 3.5 between about t = 6.5 and t = 11.5, and between about t = 18.5 and t = 23.5.
(11.5 − 6.5) + (23.5 − 18.5) = 5 + 5 = 10
The boat cannot use the harbour for about 10 hours.

Explanation

The boat cannot use the harbour while the curve is below the line d = 3.5. The tide pattern repeats every 12 hours, so the curve dips below 3.5 m twice in a day; find both intervals and add their lengths. Each small square across is half an hour, so give times to the nearest quarter of an hour or so.

Mark scheme
  1. 1 mark

    M1 for reading across from d = 3.5 to the curve (at least two crossing points)

    correct answer with no working scores full marks

  2. 1 mark

    A1 for the four times, each within 0.25 hours of 6.5, 11.5, 18.5 and 23.5

    exact 6.48..., 11.51..., 18.48..., 23.51...

  3. 1 mark

    M1 for adding the lengths of both intervals when d < 3.5, e.g. (11.5 − 6.5) + (23.5 − 18.5)

    ft their times

  4. 1 mark

    A1 for an answer from 9.6 to 10.6 hours

    exact 10.06...

Ready to try the rest? Every answer you write is marked against the mark scheme, so you can see exactly where the marks are.

AI Tutor Hints first, answers after you try

Hi! Stuck? Ask me for a hint and I’ll help you work it out. Once you’ve checked your answer I can explain exactly where the marks are.