Level:
Correct: 0
Incorrect: 0
Marks: 0/0
Exam Practice
Subject:
Topics:
Edexcel GCSE Maths (Calculator) Smart practice A mixed round aimed at your weak spots
Unit 1
Number
Unit 2
Algebra
Unit 3
Ratio, proportion and rates of change
Unit 4
Geometry and measures
Unit 5
Probability
Unit 6
Statistics
Avg
score:
–
Topics
done:
0/97

Average and instantaneous rates of change

Practise 28 exam-style questions on Average and instantaneous rates of change for Edexcel GCSE Maths (Calculator). Write your answer as you would in the exam and get it marked in seconds against the mark scheme, point by point, with an AI tutor on hand if you get stuck.

  • 28 questions
  • 1–5 marks each
  • Instant marking
  • No sign-up needed
20 questions, marked as you go

Sample questions with model answers

Here are 4 of the questions in this topic, each with a model answer, an explanation of why it earns the marks and the mark scheme an examiner would use.

Question 1

2 marks

An oven is switched on. The table shows the temperature inside the oven at different times after it is switched on.

Work out the average rate of increase of the temperature between 2 minutes and 8 minutes.
Give the units of your answer.
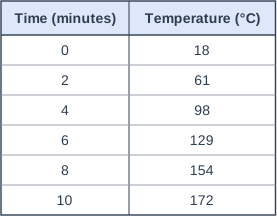
Table with columns "Time (minutes)", "Temperature (°C)". Time (minutes): 0; Temperature (°C): 18 | Time (minutes): 2; Temperature (°C): 61 | Time (minutes): 4; Temperature (°C): 98 | Time (minutes): 6; Temperature (°C): 129 | Time (minutes): 8; Temperature (°C): 154 | Time (minutes): 10; Temperature (°C): 172.

Model answer

Change in temperature = 154 − 61 = 93 °C
Change in time = 8 − 2 = 6 minutes
Average rate = \(\dfrac{93}{6} = 15.5\) °C per minute

Explanation

The average rate of change over an interval is the gradient of the chord joining the two points: change in temperature divided by change in time. The units are the units of temperature per unit of time. A common mistake is to divide 154 by 8, which gives the average rate from 0 minutes instead of from 2 minutes.

Mark scheme
  1. 1 mark

    M1 for \(\dfrac{154 - 61}{8 - 2}\) oe

    may be seen as 93 ÷ 6

  2. 1 mark

    A1 for 15.5 °C per minute

    cao; units required for this mark (°C/min oe); correct answer with no working scores full marks
Question 2

2 marks

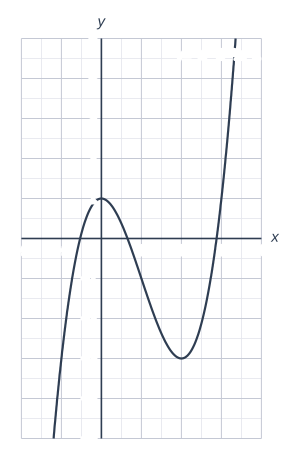
The diagram shows the graph of \(y = x^3 - 3x^2 + 1\).

Write down the \(x\)-coordinates of the points on the curve where the instantaneous rate of change of \(y\) is zero.
Give a reason for your answer.

A coordinate grid with x from −2 to 4 and y from −5 to 5; each grid square is 1 unit across (with 2 small squares along each side of a large square), and the axes cross at the origin O. The curve labelled "y = x³ − 3x² + 1" is an S-shaped cubic curve, rising from bottom left to top right: it crosses the x-axis at about (−0.5, 0), about (0.7, 0) and about (2.9, 0); it crosses the y-axis at (0, 1); it has turning points (maximum and minimum), which can be read from the grid.

Model answer

\(x = 0\) and \(x = 2\)
These are the turning points of the curve. The tangent at each turning point is horizontal, so its gradient (the instantaneous rate of change of \(y\)) is zero.

Explanation

The instantaneous rate of change is the gradient of the tangent. At a maximum or minimum point the tangent is horizontal, so the rate of change is zero there. Read the \(x\)-coordinates of the turning points, not the \(y\)-coordinates.

Mark scheme
  1. 1 mark

    B1 for \(x = 0\) and \(x = 2\)

    both required

  2. 1 mark

    C1 for a reason, e.g. "these are the turning points, where the tangent is horizontal so its gradient is 0"

    oe

Question 3

3 marks

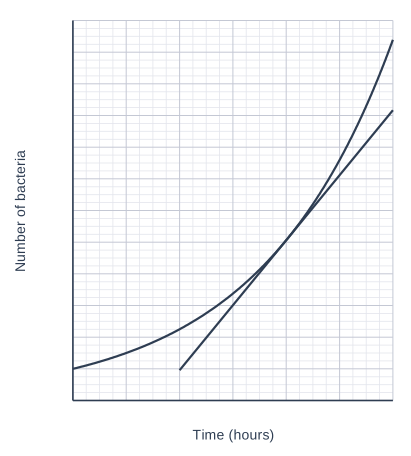
The graph shows the number of bacteria, \(N\), in a dish \(t\) hours after the start of an experiment.
A tangent to the curve has been drawn at \(t = 4\).

Use the graph to estimate the rate at which the number of bacteria is increasing at \(t = 4\).
Give the units of your answer.

A graph of Number of bacteria (vertical axis, 0 to 2400, marked every 200) against Time (hours) (horizontal axis, 0 to 6, marked every 1), on a grid with 4 small squares to each large square. The curve is an exponential curve, increasing more and more steeply from left to right: it crosses the y-axis at (0, 200); it gets closer and closer to the line y = 0 (the x-axis) as x goes further left without reaching it. The tangent is a straight line touching the curve at (4, 1012.5), drawn from x = 2 to x = 6; its position can be read from the grid.

Model answer

Two points on the tangent: (2, 190) and (6, 1830)
Gradient \(= \dfrac{1830 - 190}{6 - 2} = \dfrac{1640}{4} = 410\)
The number of bacteria is increasing at about 410 bacteria per hour.

Explanation

The rate of increase at an instant is the gradient of the tangent at that time. Read two points on the tangent as far apart as possible and divide the change in \(N\) by the change in \(t\). The units are bacteria per hour because \(N\) is a number of bacteria and \(t\) is in hours.

Mark scheme
  1. 1 mark

    M1 for reading two points on the tangent, e.g. (2, 190) and (6, 1830)

    readings within one small square; correct answer with no working scores full marks
  2. 1 mark

    M1 for \(\dfrac{\text{difference in } N}{\text{difference in } t}\) for their points, e.g. \(\dfrac{1830 - 190}{6 - 2}\)

  3. 1 mark

    A1 for an answer in the range 370 to 450 bacteria per hour

    true value 410.5...; units required

Question 4

4 marks

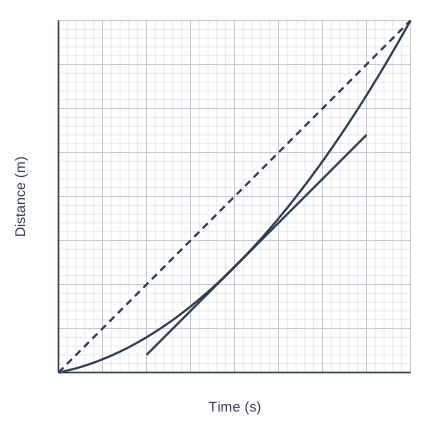
The graph shows the distance, \(d\) metres, travelled by a cyclist \(t\) seconds after she starts to move.
The chord from (0, 0) to (8, 80) and the tangent to the curve at \(t = 4\) have been drawn.

Ben says,
"The cyclist's speed at \(t = 4\) is the same as her average speed for the first 8 seconds."

Is Ben correct?
You must show how you get your answer.

A graph of Distance (m) (vertical axis, 0 to 80, marked every 10) against Time (s) (horizontal axis, 0 to 8, marked every 1), on a grid with 5 small squares to each large square. The curve is a U-shaped parabola: it crosses the x-axis at (0, 0). The dashed line is a straight line sloping upwards from left to right passing through the origin and (3, 30). The tangent is a straight line touching the curve at (4, 24), drawn from x = 2 to x = 7 passing through (3, 14) and (6, 44). The curve and the dashed line cross at (0, 0) and (8, 80).

Model answer

Average speed for the first 8 seconds = gradient of chord \(= \dfrac{80 - 0}{8 - 0} = 10\) m/s
Two points on the tangent: (2, 4) and (7, 54)
Speed at \(t = 4\) = gradient of tangent \(= \dfrac{54 - 4}{7 - 2} = \dfrac{50}{5} = 10\) m/s
Both are 10 m/s (the tangent is parallel to the chord), so Ben is correct.

Explanation

The average speed over the first 8 seconds is the gradient of the chord; the speed at \(t = 4\) is the gradient of the tangent. Here the two lines are parallel, so the gradients are equal. A common wrong method is to work out \(24 \div 4 = 6\), which is the average speed for the first 4 seconds, not the speed at \(t = 4\).

Mark scheme
  1. 1 mark

    M1 for the average speed: \(\dfrac{80 - 0}{8 - 0}\) (= 10 m/s)

  2. 1 mark

    M1 for a method to find the gradient of the tangent at \(t = 4\), e.g. \(\dfrac{54 - 4}{7 - 2}\)

    points read from the tangent

  3. 1 mark

    A1 for average speed 10 and gradient of tangent in the range 9 to 11

  4. 1 mark

    C1 for "Yes" (both are about 10 m/s; the tangent is parallel to the chord)

    ft their values from correct methods; do not accept a conclusion based on 24 ÷ 4 = 6

Ready to try the rest? Every answer you write is marked against the mark scheme, so you can see exactly where the marks are.

AI Tutor Hints first, answers after you try

Hi! Stuck? Ask me for a hint and I’ll help you work it out. Once you’ve checked your answer I can explain exactly where the marks are.