
Level:
Correct: 0
Incorrect: 0
Marks: 0/0
Exam Practice
Subject:
Topics:
Edexcel GCSE Maths (Calculator) Smart practice A mixed round aimed at your weak spots
Unit 1
Number
Unit 2
Algebra
Unit 3
Ratio, proportion and rates of change
Unit 4
Geometry and measures
Unit 5
Probability
Unit 6
Statistics
Avg
score:
–
Topics
done:
0/97

Histograms and cumulative frequency

Practise 36 exam-style questions on Histograms and cumulative frequency for Edexcel GCSE Maths (Calculator). Write your answer as you would in the exam and get it marked in seconds against the mark scheme, point by point, with an AI tutor on hand if you get stuck.

  • 36 questions
  • 1–5 marks each
  • Instant marking
  • No sign-up needed
20 questions, marked as you go

Sample questions with model answers

Here are 4 of the questions in this topic, each with a model answer, an explanation of why it earns the marks and the mark scheme an examiner would use.

Question 1

2 marks

The histogram shows information about the heights, h cm, of some seedlings.

Work out the number of seedlings with heights between 4 cm and 7 cm.
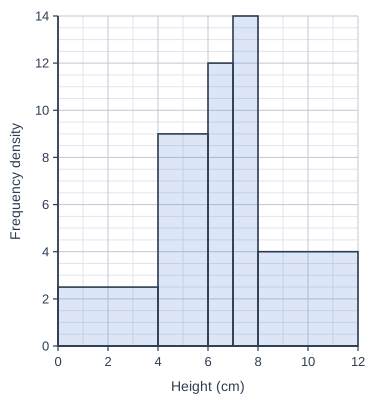
Histogram drawn on a grid of small squares. The horizontal axis is "Height (cm)", from 0 to 12, numbered every 2, with 2 small squares between numbered values (each small square is 1). The vertical axis is "Frequency density", from 0 to 14, numbered every 2, with 4 small squares between numbered values (each small square is 0.5). The bars touch, with no gaps between them. Bars: from 0 to 4, height 2.5; from 4 to 6, height 9; from 6 to 7, height 12; from 7 to 8, height 14; from 8 to 12, height 4.

Model answer

Frequency = frequency density × class width
\(4 < h \le 6\): \(2 \times 9 = 18\)
\(6 < h \le 7\): \(1 \times 12 = 12\)
\(18 + 12 = 30\) seedlings

Explanation

In a histogram the area of each bar gives the frequency, so multiply the frequency density (the height) by the class width. A common mistake is to read the heights 9 and 12 as frequencies and give 21.

Mark scheme
  1. 1 mark

    M1 for a correct method to find the frequency of one of the classes, e.g. \(2 \times 9\) (= 18) or \(1 \times 12\) (= 12)

    frequency = frequency density × class width

  2. 1 mark

    A1 for 30

    cao; correct answer with no working scores full marks
Question 2

3 marks

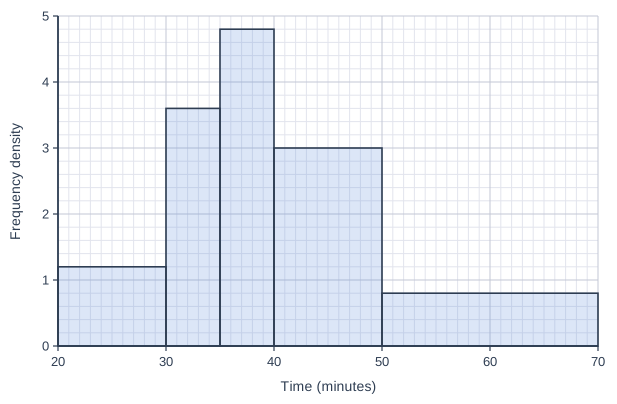
The histogram shows information about the times, t minutes, taken by the runners in a fun run.

Estimate the number of runners who took more than 45 minutes.

Histogram drawn on a grid of small squares. The horizontal axis is "Time (minutes)", from 20 to 70, numbered every 10, with 10 small squares between numbered values (each small square is 1). The vertical axis is "Frequency density", from 0 to 5, numbered every 1, with 5 small squares between numbered values (each small square is 0.2). The bars touch, with no gaps between them. Bars: from 20 to 30, height 1.2; from 30 to 35, height 3.6; from 35 to 40, height 4.8; from 40 to 50, height 3; from 50 to 70, height 0.8.

Model answer

From 45 to 50: \(5 \times 3 = 15\)
From 50 to 70: \(20 \times 0.8 = 16\)
\(15 + 16 = 31\) runners

Explanation

45 minutes is halfway through the class 40 < t ≤ 50, so assume the runners are spread evenly across the class and take the area of the bar from 45 to 50 only. Then add the whole of the bars beyond 50. A common mistake is to include the whole 40 < t ≤ 50 class.

Mark scheme
  1. 1 mark

    M1 for the part of the class 40 < t ≤ 50 above 45, e.g. \(5 \times 3\) (= 15) or \(\frac{1}{2} \times 30\)

  2. 1 mark

    M1 for adding the frequency of the class 50 < t ≤ 70, e.g. \(15 + 20 \times 0.8\)

    16 runners in 50 < t ≤ 70

  3. 1 mark

    A1 for 31

    cao; correct answer with no working scores full marks
Question 3

3 marks

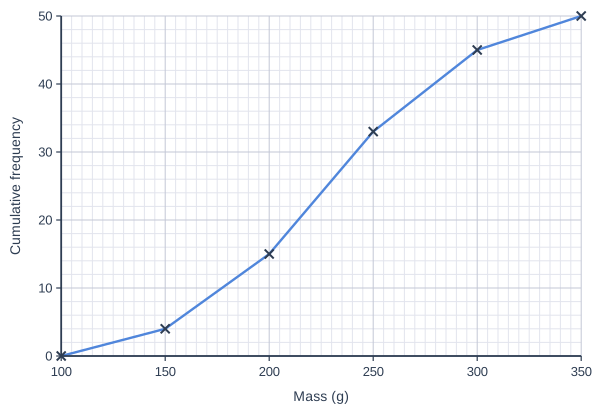
The cumulative frequency graph shows information about the masses, m grams, of 50 potatoes.

Harry wants to show the same information in a histogram.

Work out the frequency density for the class 200 < m ≤ 250.

Cumulative frequency graph on a grid of small squares. The horizontal axis is "Mass (g)", from 100 to 350, numbered every 50, with 10 small squares between numbered values (each small square is 5). The vertical axis is "Cumulative frequency", from 0 to 50, numbered every 10, with 5 small squares between numbered values (each small square is 2). Straight lines join (100, 0), (150, 4), (200, 15), (250, 33), (300, 45) and (350, 50) (each point is marked with a cross).

Model answer

Cumulative frequency at 200 g = 15; at 250 g = 33
Frequency of 200 < m ≤ 250 = 33 − 15 = 18
Frequency density = \(18 \div 50 = 0.36\)

Explanation

The frequency of a class is the increase in cumulative frequency across it, so subtract the cumulative frequencies at its two boundaries. Then divide by the class width to get the frequency density. Using the cumulative frequency 33 itself as the frequency is a common mistake.

Mark scheme
  1. 1 mark

    M1 for reading the cumulative frequencies at 200 and 250 (15 and 33)

    correct answer with no working scores full marks
  2. 1 mark

    M1 for the frequency of the class (33 − 15 = 18) divided by the class width 50

    ft their frequency

  3. 1 mark

    A1 for 0.36

    cao

Question 4

4 marks

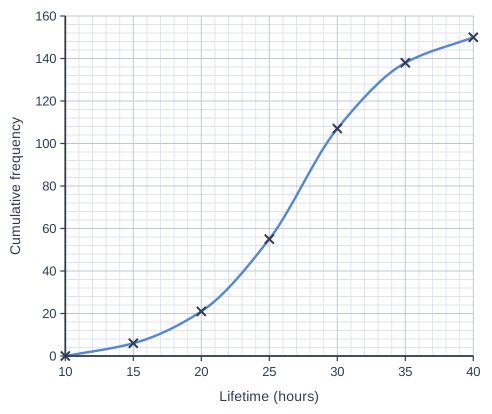
A factory tests the lifetimes, h hours, of a sample of 150 of its batteries.
The cumulative frequency graph shows information about the results.

A battery that lasts less than 18 hours is rejected.
The factory makes 5000 of these batteries each day.

Use the graph to estimate the number of batteries made each day that would be rejected.

Cumulative frequency graph on a grid of small squares. The horizontal axis is "Lifetime (hours)", from 10 to 40, numbered every 5, with 5 small squares between numbered values (each small square is 1). The vertical axis is "Cumulative frequency", from 0 to 160, numbered every 20, with 5 small squares between numbered values (each small square is 4). A smooth curve starts at (10, 0) and passes through (15, 6), (20, 21), (25, 55), (30, 107), (35, 138) and (40, 150) (each point is marked with a cross).

Model answer

At 18 hours the cumulative frequency is about 13.5
Proportion rejected ≈ \(\frac{13.5}{150} = 0.09\)
Each day: \(0.09 \times 5000 = 450\) batteries

Explanation

The cumulative frequency at 18 hours is the number of batteries in the sample that lasted 18 hours or less. Assuming the sample is representative of all the batteries, the same proportion of each day's 5000 will be rejected. Reading the number of batteries that last more than 18 hours instead is a common slip.

Mark scheme
  1. 1 mark

    P1 for reading the cumulative frequency at 18 hours, e.g. 13 or 14

    accept 12 to 15; correct answer with no working scores full marks

  2. 1 mark

    P1 for the proportion rejected, e.g. \(\frac{13.5}{150}\) (= 0.09)

    ft their reading

  3. 1 mark

    P1 for their proportion × 5000

  4. 1 mark

    A1 for an answer in the range 400 to 500

    from the curve: 13.5 batteries, giving 450

Ready to try the rest? Every answer you write is marked against the mark scheme, so you can see exactly where the marks are.

AI Tutor Hints first, answers after you try

Hi! Stuck? Ask me for a hint and I’ll help you work it out. Once you’ve checked your answer I can explain exactly where the marks are.