
Level:
Correct: 0
Incorrect: 0
Marks: 0/0
Exam Practice
Subject:
Topics:
Edexcel GCSE Maths (Calculator) Smart practice A mixed round aimed at your weak spots
Unit 1
Number
Unit 2
Algebra
Unit 3
Ratio, proportion and rates of change
Unit 4
Geometry and measures
Unit 5
Probability
Unit 6
Statistics
Avg
score:
–
Topics
done:
0/97

Averages, spread and box plots

Practise 36 exam-style questions on Averages, spread and box plots for Edexcel GCSE Maths (Calculator). Write your answer as you would in the exam and get it marked in seconds against the mark scheme, point by point, with an AI tutor on hand if you get stuck.

  • 36 questions
  • 1–5 marks each
  • Instant marking
  • No sign-up needed
20 questions, marked as you go

Sample questions with model answers

Here are 4 of the questions in this topic, each with a model answer, an explanation of why it earns the marks and the mark scheme an examiner would use.

Question 1

2 marks

The box plot shows information about the ages of the members of a choir.

Work out the interquartile range of the ages.
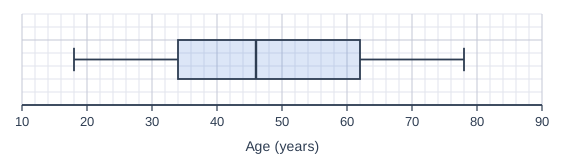
A box plot drawn above a horizontal scale "Age (years)" from 10 to 90, numbered every 10, with 5 small squares between numbered values (each small square is 2), on a grid of small squares. The box plot: lowest value (left end of the left whisker) 18; lower quartile (left side of the box) can be read from the scale; median (line inside the box) 46; upper quartile (right side of the box) can be read from the scale; highest value (right end of the right whisker) 78.

Model answer

Lower quartile = 34, upper quartile = 62
Interquartile range = 62 − 34 = 28 years

Explanation

The interquartile range is the width of the box: upper quartile minus lower quartile. It measures the spread of the middle half of the ages. Using the ends of the whiskers instead gives the range, not the interquartile range.

Mark scheme
  1. 1 mark

    M1 for upper quartile − lower quartile, e.g. 62 − 34

    both quartiles read correctly

  2. 1 mark

    A1 for 28 years

    cao; correct answer with no working scores full marks
Question 2

3 marks

Here are the masses, in kg, of 15 suitcases.

14.2 18.6 9.8 21.3 16.4 23.7 12.5 19.9
17.1 15.8 22.4 11.6 20.5 13.9 18.0

Kirsty wants to show these masses on a box plot.

Find the lowest value, the lower quartile, the median, the upper quartile and the highest value.

Model answer

In order:
9.8, 11.6, 12.5, 13.9, 14.2, 15.8, 16.4, 17.1, 18.0, 18.6, 19.9, 20.5, 21.3, 22.4, 23.7
Lowest = 9.8 kg, highest = 23.7 kg
Median = \(\frac{15 + 1}{2}\) = 8th value = 17.1 kg
Lower quartile = \(\frac{15 + 1}{4}\) = 4th value = 13.9 kg
Upper quartile = \(\frac{3(15 + 1)}{4}\) = 12th value = 20.5 kg

Explanation

Always put the data in order first. With 15 values the median is the 8th, and the quartiles are the 4th and 12th values (the middles of the lower and upper halves). Forgetting to order the data is the most common reason for losing these marks.

Mark scheme
  1. 1 mark

    B1 for the lowest value 9.8 and the highest value 23.7

    cao; correct answer with no working scores full marks

  2. 1 mark

    B1 for the median 17.1

    cao; the 8th value in order

  3. 1 mark

    B1 for the lower quartile 13.9 and the upper quartile 20.5

    cao; the 4th and 12th values in order

Question 3

3 marks

Here are the numbers of visitors to a museum on each of 11 days.

312 287 341 298 305 1240 326 293 318 301 334

On one of the days there was a special event.

Work out the range and the interquartile range of the numbers of visitors.
Which of these is the better measure of the spread of the data? Give a reason for your answer.

Model answer

In order: 287, 293, 298, 301, 305, 312, 318, 326, 334, 341, 1240
Range = 1240 − 287 = 953
Lower quartile = 3rd value = 298; upper quartile = 9th value = 334
IQR = 334 − 298 = 36
The IQR is better: the range is hugely increased by the one extreme value of 1240 (the special event), while the IQR is not affected by it and shows that the numbers on normal days are close together.

Explanation

With 11 values the quartiles are the 3rd and 9th values in order. The range depends only on the largest and smallest values, so one outlier makes it unrepresentative. The interquartile range measures the spread of the middle 50% and ignores extreme values, which is why it is preferred when there are outliers.

Mark scheme
  1. 1 mark

    B1 for the range, 1240 − 287 = 953

    cao

  2. 1 mark

    B1 for the interquartile range, 334 − 298 = 36

    cao; quartiles are the 3rd and 9th values in order

  3. 1 mark

    C1 for the interquartile range, with a reason, e.g. the range is distorted by the extreme value 1240 (the special event, an outlier), but the IQR uses only the middle half of the data so it is not affected

    oe

Question 4

4 marks

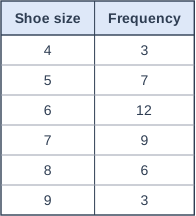
The table shows the shoe sizes of 40 customers at a shoe shop.

Nadia says,
"The median shoe size is greater than the mean shoe size."

Is Nadia correct?
You must show how you get your answer.

Table with columns "Shoe size", "Frequency". Shoe size: 4; Frequency: 3 | Shoe size: 5; Frequency: 7 | Shoe size: 6; Frequency: 12 | Shoe size: 7; Frequency: 9 | Shoe size: 8; Frequency: 6 | Shoe size: 9; Frequency: 3.

Model answer

\(\sum fx = 12 + 35 + 72 + 63 + 48 + 27 = 257\)
Mean = \(257 \div 40 = 6.425\)
Median: the 20th and 21st values. Cumulative frequencies: 3, 10, 22, ... so both are size 6. Median = 6
6 < 6.425, so Nadia is not correct.

Explanation

Work out both averages. For the median of 40 values, find the 20th and 21st values with a running total of the frequencies; here both are 6. The mean is pulled up by the larger sizes 7, 8 and 9, so it is higher than the median.

Mark scheme
  1. 1 mark

    M1 for \(\sum fx\), e.g. \(4 \times 3 + 5 \times 7 + 6 \times 12 + 7 \times 9 + 8 \times 6 + 9 \times 3\) (= 257)

  2. 1 mark

    A1 for the mean 6.425

    accept 6.4 or 6.43

  3. 1 mark

    B1 for the median 6

    20th and 21st values are both 6

  4. 1 mark

    C1 for No, with correct figures (median 6 is less than mean 6.425)

Ready to try the rest? Every answer you write is marked against the mark scheme, so you can see exactly where the marks are.

AI Tutor Hints first, answers after you try

Hi! Stuck? Ask me for a hint and I’ll help you work it out. Once you’ve checked your answer I can explain exactly where the marks are.