
Level:
Correct: 0
Incorrect: 0
Marks: 0/0
Exam Practice
Subject:
Topics:
Edexcel GCSE Maths (Calculator) Smart practice A mixed round aimed at your weak spots
Unit 1
Number
Unit 2
Algebra
Unit 3
Ratio, proportion and rates of change
Unit 4
Geometry and measures
Unit 5
Probability
Unit 6
Statistics
Avg
score:
–
Topics
done:
0/97

Relative frequency and the probability scale

Practise 28 exam-style questions on Relative frequency and the probability scale for Edexcel GCSE Maths (Calculator). Write your answer as you would in the exam and get it marked in seconds against the mark scheme, point by point, with an AI tutor on hand if you get stuck.

  • 28 questions
  • 1–5 marks each
  • Instant marking
  • No sign-up needed
20 questions, marked as you go

Sample questions with model answers

Here are 4 of the questions in this topic, each with a model answer, an explanation of why it earns the marks and the mark scheme an examiner would use.

Question 1

2 marks

A biased coin is spun 80 times.
It lands on heads 46 times.

The coin is going to be spun 1000 more times.
Work out an estimate for the number of times it will land on tails.

Model answer

Number of tails = 80 − 46 = 34
Relative frequency of tails = \(\frac{34}{80} = 0.425\)
Estimate = 0.425 × 1000 = 425

Explanation

The coin is biased, so you cannot assume P(tails) = 0.5; instead use the relative frequency from the experiment as an estimate of the probability. Then multiply by the number of future spins. A common mistake is to use the relative frequency of heads by accident.

Mark scheme
  1. 1 mark

    M1 for \(\frac{34}{80}\) (= 0.425) or \(1 - \frac{46}{80}\)

    oe

  2. 1 mark

    A1 for 425

    cao; correct answer with no working scores full marks
Question 2

3 marks

Ffion spins a five-sided spinner a number of times.
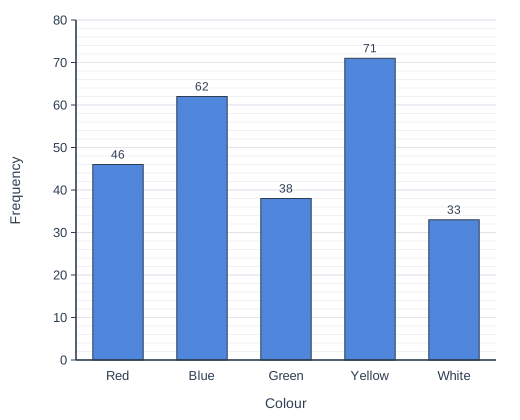
The bar chart shows the colours the spinner landed on.

Ffion is going to spin the spinner another 1200 times.
Work out an estimate for the number of times the spinner will land on yellow.

Bar chart of frequency for each colour: Red 46, Blue 62, Green 38, Yellow 71, White 33.

Model answer

Total number of spins = 46 + 62 + 38 + 71 + 33 = 250
Relative frequency of yellow = \(\frac{71}{250} = 0.284\)
Estimate = 0.284 × 1200 = 340.8
About 341 times

Explanation

First find the total number of spins from the bar chart, then the relative frequency of yellow (71 out of 250). This is the best estimate of the probability of yellow, so multiply it by the 1200 future spins. A common mistake is to divide 71 by the number of colours instead of the number of spins.

Mark scheme
  1. 1 mark

    M1 for the total 46 + 62 + 38 + 71 + 33 (= 250)

  2. 1 mark

    M1 for \(\frac{71}{250} \times 1200\) or 0.284 × 1200

    ft their total

  3. 1 mark

    A1 for 340.8 or 341

    accept 340 to 341; correct answer with no working scores full marks
Question 3

3 marks

80 students each completed a puzzle.
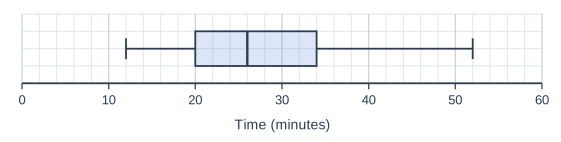
The box plot shows information about the times they took.

A group of 240 similar students are going to complete the same puzzle.
Use the box plot to work out an estimate for the number of these 240 students who will take more than 20 minutes.

A box plot drawn above a horizontal scale "Time (minutes)" from 0 to 60, numbered every 10, with 5 small squares between numbered values (each small square is 2), on a grid of small squares. The box plot: lowest value (left end of the left whisker) 12; lower quartile (left side of the box) 20; median (line inside the box) 26; upper quartile (right side of the box) 34; highest value (right end of the right whisker) 52.

Model answer

From the box plot, the lower quartile is 20 minutes.
So about \(\frac{3}{4}\) of the students took more than 20 minutes.
Estimate = \(\frac{3}{4} \times 240 = 180\) students

Explanation

A quarter of the data lies below the lower quartile, so three quarters lies above it. The relative frequency 3/4 from the 80 students is used as the probability for a similar student, then multiplied by 240. A common mistake is to use the median, which splits the data in half.

Mark scheme
  1. 1 mark

    M1 for recognising that 20 minutes is the lower quartile, so \(\frac{3}{4}\) (or 75%) of students took more than 20 minutes

    oe, e.g. 60 out of 80; correct answer with no working scores full marks

  2. 1 mark

    M1 for \(\frac{3}{4} \times 240\)

    ft their fraction

  3. 1 mark

    A1 for 180

    cao

Question 4

5 marks

At a fair, Kit runs a hoop game.
It costs £1.50 to play the game once. A player who wins gets £12.

In a trial before the fair, 34 out of 400 games were won.

Kit expects 650 games to be played at the fair.
It costs Kit £280 to hire the stall.

Will Kit make enough money from the game to pay for the stall?
You must show how you get your answer.

Model answer

Relative frequency of a win = \(\frac{34}{400} = 0.085\)
Expected number of wins = 0.085 × 650 = 55.25
Expected prize money = 55.25 × £12 = £663
Money taken = 650 × £1.50 = £975
Expected profit = £975 − £663 = £312
£312 > £280, so yes, Kit should make enough to pay for the stall (with about £32 left over).

Explanation

The trial's relative frequency, 34/400, is the best estimate of the probability of a win. Multiply by the number of games to estimate the number of winners, and so the prize money. The profit is the money taken minus the prizes; compare it with the £280 hire cost. It is only an estimate, so Kit could still be unlucky.

Mark scheme
  1. 1 mark

    P1 for \(\frac{34}{400}\) (= 0.085)

    oe

  2. 1 mark

    P1 for their 0.085 × 650 (= 55.25) expected wins

  3. 1 mark

    P1 for their 55.25 × 12 (= 663) prize money

    or 0.085 × 12 (= 1.02) expected prize per game

  4. 1 mark

    P1 for 650 × 1.50 (= 975) − their 663 (= 312)

    or (1.50 − 1.02) × 650 (= 312)

  5. 1 mark

    C1 for yes, with £312 compared to £280

    conclusion must follow correct figures; accept "yes, £32 more than needed"

Ready to try the rest? Every answer you write is marked against the mark scheme, so you can see exactly where the marks are.

AI Tutor Hints first, answers after you try

Hi! Stuck? Ask me for a hint and I’ll help you work it out. Once you’ve checked your answer I can explain exactly where the marks are.