Level:
Correct: 0
Incorrect: 0
Marks: 0/0
Exam Practice
Course:
Topics:
OCR GCSE Maths (Higher non-calculator) Smart practice A mixed round aimed at your weak spots
Unit 1
Number Operations and Integers
Unit 2
Fractions, Decimals and Percentages
Unit 3
Indices and Surds
Unit 4
Approximation and Estimation
Unit 5
Ratio, Proportion and Rates of Change
Unit 6
Algebra
Unit 7
Graphs of Equations and Functions
Unit 8
Basic Geometry
Unit 9
Congruence and Similarity
Unit 10
Mensuration
Unit 11
Probability
Unit 12
Statistics
Avg
score:
–
Topics
done:
0/121

Scatter graphs, correlation and outliers

Practise 16 exam-style questions on Scatter graphs, correlation and outliers for OCR GCSE Maths (Higher non-calculator). Write your answer as you would in the exam and get it marked in seconds against the mark scheme, point by point, with the Study Helper on hand if you get stuck.

  • 16 questions
  • 1–4 marks each
  • Instant marking
  • No sign-up needed
16 questions, marked as you go

Sample questions with model answers

Here are 4 of the questions in this topic, each with a model answer, an explanation of why it earns the marks and the mark scheme an examiner would use.

Question 1

2 marks

The scatter graph shows the age and the value of 12 cars of the same model.

Describe the relationship between the age of a car and its value.
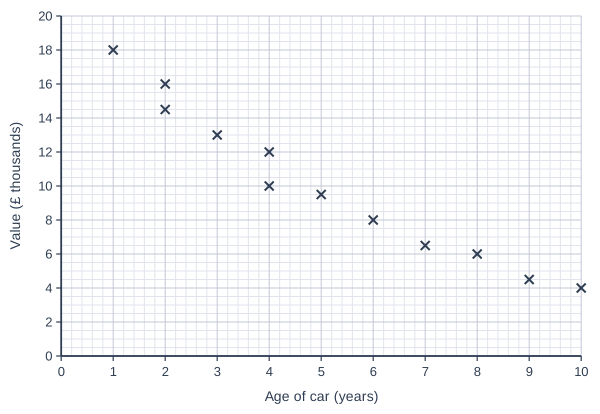
Scatter graph on a grid of small squares. The horizontal axis is "Age of car (years)", from 0 to 10, numbered every 1, with 5 small squares between numbered values (each small square is 0.2). The vertical axis is "Value (£ thousands)", from 0 to 20, numbered every 2, with 4 small squares between numbered values (each small square is 0.5). 12 points are plotted as crosses: (1, 18), (2, 16), (2, 14.5), (3, 13), (4, 12), (4, 10), (5, 9.5), (6, 8), (7, 6.5), (8, 6), (9, 4.5) and (10, 4).

Model answer

There is negative correlation: the older the car, the lower its value tends to be.

Explanation

The points slope downwards from left to right, which is negative correlation. Describing the relationship in context means saying what it tells you about the two variables: older cars of this model are generally worth less.

Mark scheme
  1. 1 mark

    B1 for negative correlation

  2. 1 mark

    B1 for the older the car, the lower its value oe

    Must be in context. Accept 'as the age increases the value decreases'. Do not accept 'the cars get cheaper' with no reference to age.
Question 2

2 marks

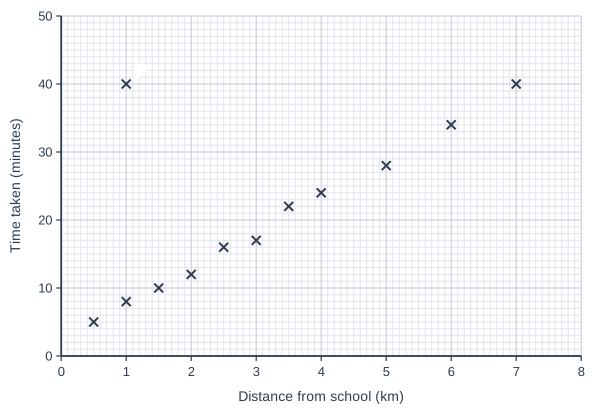
The scatter graph shows the distance from school and the time taken to travel to school for 12 students.

Point P does not fit the pattern of the other points.

Write down the coordinates of point P and suggest a reason why it does not fit the pattern.

Scatter graph on a grid of small squares. The horizontal axis is "Distance from school (km)", from 0 to 8, numbered every 1, with 10 small squares between numbered values (each small square is 0.1). The vertical axis is "Time taken (minutes)", from 0 to 50, numbered every 10, with 10 small squares between numbered values (each small square is 1). 12 points are plotted as crosses: (0.5, 5), (1, 8), (1.5, 10), (2, 12), (2.5, 16), (3, 17), (3.5, 22), (4, 24), (5, 28), (6, 34) and (7, 40), plus a point labelled P. (The labelled point's coordinates can be read from the grid.)

Model answer

P is at (1, 40): the student lives 1 km from school but took 40 minutes.
The other students who live about 1 km away took less than 10 minutes, so this student may have stopped on the way, or the time may have been recorded wrongly.

Explanation

An outlier is a value that does not fit the pattern of the rest of the data. It may be a genuine but unusual value (a student who stopped on the way) or an error in recording the data. Outliers should be ignored when drawing a line of best fit.

Mark scheme
  1. 1 mark

    B1 for (1, 40)

    correct answer with no working scores full marks

  2. 1 mark

    B1 for a sensible reason in context

    e.g. the student lives close but walked slowly / stopped on the way (e.g. at a shop or to wait for a friend) / waited a long time for a bus / the time was recorded wrongly. Do not accept 'it is an outlier' alone.

Question 3

2 marks

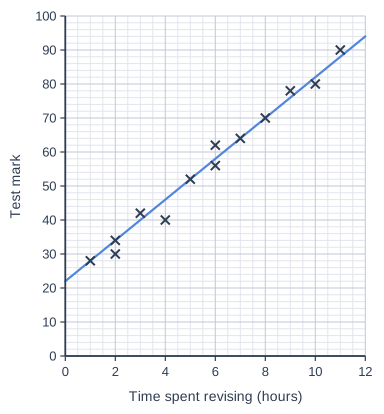
The scatter graph shows the time spent revising and the test mark for 13 students.
A line of best fit has been drawn.

Work out the gradient of the line of best fit and explain what it means in this context.

Scatter graph on a grid of small squares. The horizontal axis is "Time spent revising (hours)", from 0 to 12, numbered every 2, with 4 small squares between numbered values (each small square is 0.5). The vertical axis is "Test mark", from 0 to 100, numbered every 10, with 5 small squares between numbered values (each small square is 2). 13 points are plotted as crosses: (1, 28), (2, 34), (2, 30), (3, 42), (4, 40), (5, 52), (6, 56), (6, 62), (7, 64), (8, 70), (9, 78), (10, 80) and (11, 90). A straight line of best fit is drawn through the points; where it goes can be read from the grid.

Model answer

The line passes through (0, 22) and (10, 82).
Gradient = \(\dfrac{82 - 22}{10 - 0} = \dfrac{60}{10} = 6\)
This means that, on average, each extra hour spent revising is linked to about 6 more marks in the test.

Explanation

The gradient is the change in the vertical variable for each 1 unit of the horizontal variable, so here it is marks per hour of revision. Interpreting it means putting it in words using both variables. Remember that the line shows a trend, not an exact rule for every student.

Mark scheme
  1. 1 mark

    B1 for gradient 6

    From two points on the line, e.g. (0, 22) and (10, 82): 60 ÷ 10. Accept 5.8 to 6.2.

  2. 1 mark

    B1 for each extra hour of revision is linked to about 6 more marks

    FT their gradient. Must be in context: 'for every hour of revision the mark goes up by about 6' oe. Do not accept 'the line goes up 6 for every 1 across'.

Question 4

4 marks

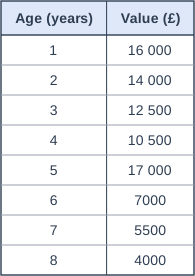
The table shows the ages and the values of 8 cars of the same model.

One of the values has been recorded incorrectly.

Which car's value is most likely to be wrong?
Give a reason, and estimate the correct value of that car.

Table with columns "Age (years)", "Value (£)". Age (years): 1; Value (£): 16 000 | Age (years): 2; Value (£): 14 000 | Age (years): 3; Value (£): 12 500 | Age (years): 4; Value (£): 10 500 | Age (years): 5; Value (£): 17 000 | Age (years): 6; Value (£): 7000 | Age (years): 7; Value (£): 5500 | Age (years): 8; Value (£): 4000.

Model answer

The car aged 5 years: its value of £17 000 is more than the values of the 1, 2, 3 and 4-year-old cars, but the values should fall as the cars get older.
The 4-year-old car is worth £10 500 and the 6-year-old car is worth £7000.
A sensible estimate is halfway between: (10 500 + 7000) ÷ 2 = £8750

Explanation

Look for the value that breaks the pattern: here the values decrease steadily with age, except for the 5-year-old car. Plotting the points would show it as an outlier. The correct value should continue the trend, so use the neighbouring values (or the typical yearly decrease) to estimate it; any value from about £8000 to £9500 is sensible.

Mark scheme
  1. 1 mark

    B1 for the car aged 5 years (£17 000)

  2. 1 mark

    B1 for a reason, e.g. it does not fit the pattern: the values decrease as the age increases, but £17 000 is more than the values of the younger cars

    Accept 'it is an outlier because older cars are worth less' oe.

  3. 1 mark

    M1 for a correct method using the trend, e.g. a value between £10 500 and £7000, or decreasing by about £1500 to £2000 a year

  4. 1 mark

    A1 for an estimate from £8000 to £9500

    e.g. £8750 (halfway between £10 500 and £7000).

Ready to try the rest? Every answer you write is marked against the mark scheme, so you can see exactly where the marks are.

Study Helper Hints first, answers after you try

Stuck on this one? Ask for a hint and I’ll point you in the right direction, without giving the answer away. Once you’ve checked your answer, I’ll show you how the marks are awarded.