
Level:
Correct: 0
Incorrect: 0
Marks: 0/0
Exam Practice
Course:
Topics:
OCR GCSE Maths (Higher non-calculator) Smart practice A mixed round aimed at your weak spots
Unit 1
Number Operations and Integers
Unit 2
Fractions, Decimals and Percentages
Unit 3
Indices and Surds
Unit 4
Approximation and Estimation
Unit 5
Ratio, Proportion and Rates of Change
Unit 6
Algebra
Unit 7
Graphs of Equations and Functions
Unit 8
Basic Geometry
Unit 9
Congruence and Similarity
Unit 10
Mensuration
Unit 11
Probability
Unit 12
Statistics
Avg
score:
–
Topics
done:
0/121

Comparing data and misleading graphs

Practise 15 exam-style questions on Comparing data and misleading graphs for OCR GCSE Maths (Higher non-calculator). Write your answer as you would in the exam and get it marked in seconds against the mark scheme, point by point, with the Study Helper on hand if you get stuck.

  • 15 questions
  • 1–4 marks each
  • Instant marking
  • No sign-up needed
15 questions, marked as you go

Sample questions with model answers

Here are 4 of the questions in this topic, each with a model answer, an explanation of why it earns the marks and the mark scheme an examiner would use.

Question 1

1 mark

Give one advantage of using the interquartile range rather than the range to compare the spread of two sets of data.

Model answer

The interquartile range is not affected by extreme values, because it only uses the middle 50% of the data.

Explanation

The range depends only on the largest and smallest values, so a single unusual value can make it very large. The interquartile range is the spread of the middle half of the data, so it gives a fairer picture of how spread out the typical values are.

Mark scheme
  1. 1 mark

    B1 for it is not affected by extreme values (outliers)

    Accept 'it measures the spread of the middle half of the data, so one unusual value does not change it'. Do not accept 'it is more accurate' or 'it is easier'.
Question 2

2 marks

A shoe shop manager wants to know which shoe size she should order the most of.

Should she use the mean, the median or the mode of the shoe sizes she sold last month?
Give a reason for your answer.

Model answer

The mode.
The mode is the size she sold most often, so it is the size she needs the most of. The mean could be a size that does not exist, such as 6.37.

Explanation

Each average answers a different question. The mode tells you the most common value, which is exactly what a shop needs for ordering stock. The mean of shoe sizes is unlikely to be a real size, and the median does not tell you which size is most popular.

Mark scheme
  1. 1 mark

    B1 for the mode

  2. 1 mark

    B1 for a reason, e.g. it is the most common size, so it is the size she sells most of / the mean might not be an actual shoe size

    Accept 'the mode is the size that most people buy'.

Question 3

3 marks

In Town A, 1200 of the 4000 households have a dog.
In Town B, 900 of the 2000 households have a dog.

Leila says,

'Dogs are more popular in Town A, because more households in Town A have a dog.'

Is Leila correct?
Show how you decide.

Model answer

Town A: \(\dfrac{1200}{4000} = 0.3 = 30\%\)
Town B: \(\dfrac{900}{2000} = 0.45 = 45\%\)
A higher proportion of households in Town B have a dog (45% compared with 30%).
So Leila is not correct: dogs are more popular in Town B.

Explanation

The towns are different sizes, so comparing the numbers of households is not a like-for-like comparison. Compare the proportions instead. Town A has more dogs only because it has more households.

Mark scheme
  1. 1 mark

    M1 for \(\dfrac{1200}{4000}\) or \(\dfrac{900}{2000}\) oe

    A proportion for one town, as a fraction, decimal or percentage.

  2. 1 mark

    A1 for 30% (Town A) and 45% (Town B) oe

    Accept 0.3 and 0.45, or equivalent fractions with a common denominator.

  3. 1 mark

    A1 for No, with a correct comparison, e.g. a higher proportion of households in Town B have a dog

    'No' with no working scores 0.

Question 4

4 marks

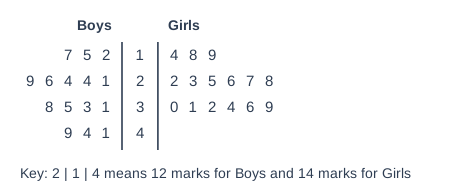
The back-to-back stem-and-leaf diagram shows the marks scored by 15 boys and 15 girls in a spelling test.

Compare the marks of the boys and the girls.
Use statistics to support your answer.

Back-to-back stem and leaf diagram. Key: 2 | 1 | 4 means 12 marks for Boys and 14 marks for Girls. The stems are in the middle column; "Boys" leaves are on the left, read outwards from the stem (smallest next to the stem), and "Girls" leaves are on the right. Rows (Boys leaves | stem | Girls leaves): 2 5 7 | 1 | 4 8 9; 1 4 4 6 9 | 2 | 2 3 5 6 7 8; 1 3 5 8 | 3 | 0 1 2 4 6 9; 1 4 9 | 4 | none.

Model answer

Boys: median = 8th value = 29, range = 49 − 12 = 37
Girls: median = 8th value = 27, range = 39 − 14 = 25
The boys' median is higher, so on average the boys scored slightly higher marks.
The girls' range is smaller, so the girls' marks were more consistent.

Explanation

Work out the same statistics for both groups (like for like), then compare an average and a spread, saying what each means for the marks. Remember that on the left of a back-to-back diagram the leaves are read from the stem outwards, so the boys' smallest mark is 12, not 17.

Mark scheme
  1. 1 mark

    B1 for the medians: boys 29 and girls 27 (or the means: boys 29.3 and girls 26.9)

    Both values needed. Means: boys 439 ÷ 15 = 29.26..., girls 404 ÷ 15 = 26.93...; accept 29.3 and 26.9 or more accurate values; correct answer with no working scores full marks

  2. 1 mark

    B1 for the ranges: boys 37 and girls 25

    Accept interquartile ranges instead: boys 17 (38 − 21) and girls 10 (32 − 22).

  3. 1 mark

    B1 for a comparison of averages in context, e.g. the boys did slightly better on average because their median is higher

    FT their medians or means.

  4. 1 mark

    B1 for a comparison of spread in context, e.g. the girls' marks were more consistent because their range is smaller

    FT their ranges or interquartile ranges.

Ready to try the rest? Every answer you write is marked against the mark scheme, so you can see exactly where the marks are.

Study Helper Hints first, answers after you try

Stuck on this one? Ask for a hint and I’ll point you in the right direction, without giving the answer away. Once you’ve checked your answer, I’ll show you how the marks are awarded.