
Level:
Correct: 0
Incorrect: 0
Marks: 0/0
Exam Practice
Course:
Topics:
OCR GCSE Maths (Higher non-calculator) Smart practice A mixed round aimed at your weak spots
Unit 1
Number Operations and Integers
Unit 2
Fractions, Decimals and Percentages
Unit 3
Indices and Surds
Unit 4
Approximation and Estimation
Unit 5
Ratio, Proportion and Rates of Change
Unit 6
Algebra
Unit 7
Graphs of Equations and Functions
Unit 8
Basic Geometry
Unit 9
Congruence and Similarity
Unit 10
Mensuration
Unit 11
Probability
Unit 12
Statistics
Avg
score:
–
Topics
done:
0/121

Averages and measures of spread

Practise 21 exam-style questions on Averages and measures of spread for OCR GCSE Maths (Higher non-calculator). Write your answer as you would in the exam and get it marked in seconds against the mark scheme, point by point, with the Study Helper on hand if you get stuck.

  • 21 questions
  • 2–5 marks each
  • Instant marking
  • No sign-up needed
20 questions, marked as you go

Sample questions with model answers

Here are 4 of the questions in this topic, each with a model answer, an explanation of why it earns the marks and the mark scheme an examiner would use.

Question 1

2 marks

The table shows information about the masses, m kg, of 40 dogs.

Write down the modal class, and explain why a mean worked out from this table can only be an estimate.
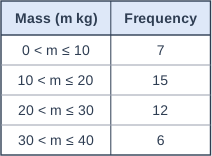
Table with columns "Mass (m kg)", "Frequency". Mass (m kg): 0 < m ≤ 10; Frequency: 7 | Mass (m kg): 10 < m ≤ 20; Frequency: 15 | Mass (m kg): 20 < m ≤ 30; Frequency: 12 | Mass (m kg): 30 < m ≤ 40; Frequency: 6.

Model answer

Modal class: \(10 < m \leqslant 20\) (it has the highest frequency, 15).
The table only tells us which class each mass is in, not the exact masses, so the midpoint of each class has to be used as an estimate for every mass in it.

Explanation

The modal class is the class with the highest frequency (all the classes here have the same width). For grouped data the actual values are lost, so an estimated mean assumes every value is at the midpoint of its class. Writing the frequency instead of the class is a common error.

Mark scheme
  1. 1 mark

    B1 for \(10 < m \leqslant 20\)

    Accept 10 to 20 kg. 15 (the frequency) scores B0.

  2. 1 mark

    B1 for the exact masses are not known / the midpoint of each class is used instead of the actual values

    Accept 'the data is grouped so we do not know the actual masses'. Do not accept 'it might be wrong' or 'not all dogs were weighed'.
Question 2

2 marks

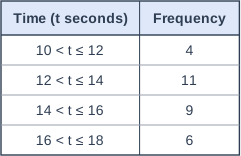
The table shows information about the times, t seconds, that 30 runners took to run 100 m.

Jo says,

'We cannot work out the range exactly, but it must be more than 4 seconds.'

Explain why Jo is correct.

Table with columns "Time (t seconds)", "Frequency". Time (t seconds): 10 < t ≤ 12; Frequency: 4 | Time (t seconds): 12 < t ≤ 14; Frequency: 11 | Time (t seconds): 14 < t ≤ 16; Frequency: 9 | Time (t seconds): 16 < t ≤ 18; Frequency: 6.

Model answer

The exact times are not known, so the range cannot be worked out exactly.
There are runners in the \(16 < t \leqslant 18\) class, so the slowest time is more than 16 seconds.
There are runners in the \(10 < t \leqslant 12\) class, so the fastest time is 12 seconds or less.
So the range is more than 16 − 12 = 4 seconds.

Explanation

For grouped data you only know which class each value is in. The smallest possible range uses the top of the lowest occupied class and the bottom of the highest occupied class; the largest possible range uses the outer boundaries (18 − 10 = 8). So the range is between 4 and 8 seconds.

Mark scheme
  1. 1 mark

    B1 for the slowest time is more than 16 seconds (there are runners in the \(16 < t \leqslant 18\) class)

  2. 1 mark

    B1 for the fastest time is at most 12 seconds (there are runners in the \(10 < t \leqslant 12\) class), so the range is more than 16 − 12 = 4

    Both parts of the argument are needed for 2 marks. Also accept an explanation that the exact times are not known, so the range cannot be found exactly, for B1 only if no other mark is scored.

Question 3

3 marks

There are 20 students in class A and 30 students in class B.
The mean test mark for class A is 64.
The mean test mark for class B is 54.

Work out the mean test mark for all 50 students.

Model answer

Total for class A = 20 × 64 = 1280
Total for class B = 30 × 54 = 1620
Mean for all students = (1280 + 1620) ÷ 50 = 2900 ÷ 50 = 58

Explanation

You cannot simply average the two means, because the classes are different sizes: class B has more students, so the overall mean is closer to 54. Find the total marks for each class, add them and divide by the total number of students.

Mark scheme
  1. 1 mark

    M1 for 20 × 64 (= 1280) or 30 × 54 (= 1620)

    correct answer with no working scores full marks

  2. 1 mark

    M1 for (1280 + 1620) ÷ 50 oe

    Their totals.

  3. 1 mark

    A1 for 58

    59 ((64 + 54) ÷ 2) scores 0.

Question 4

4 marks

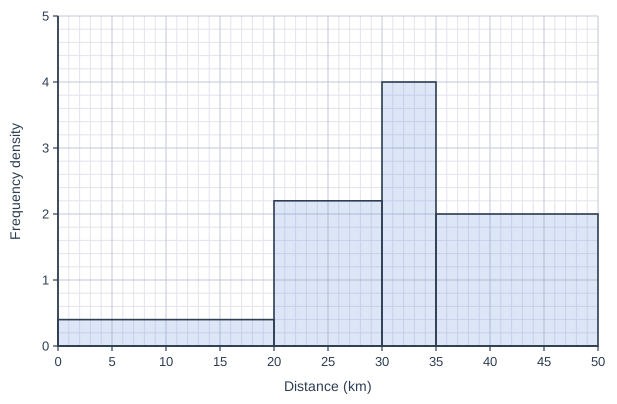
The histogram shows information about the distances, in km, that 80 people travel to work.

Work out an estimate of the median distance.

Histogram drawn on a grid of small squares. The horizontal axis is "Distance (km)", from 0 to 50, numbered every 5, with 5 small squares between numbered values (each small square is 1). The vertical axis is "Frequency density", from 0 to 5, numbered every 1, with 5 small squares between numbered values (each small square is 0.2). The bars touch, with no gaps between them. Bars: from 0 to 20, height 0.4; from 20 to 30, height 2.2; from 30 to 35, height 4; from 35 to 50, height 2.

Model answer

Frequencies: 0 to 20: 0.4 × 20 = 8; 20 to 30: 2.2 × 10 = 22; 30 to 35: 4 × 5 = 20; 35 to 50: 2 × 15 = 30
The median is the 40th value (80 ÷ 2).
Running totals: 8, 30, 50, so the median is in the 30 to 35 class, 10 values into a class of 20.
Median ≈ 30 + \(\dfrac{10}{20} \times 5\) = 32.5 km

Explanation

Find the frequencies from the areas of the bars, then the running totals to locate the class containing the 40th person. Assuming the values are spread evenly across that class, the 40th person is 10 out of 20 of the way through it, which is half of 5 km. Equivalently, find the point that splits the area of the histogram in half.

Mark scheme
  1. 1 mark

    M1 for at least two class frequencies found correctly

    Frequencies: 8, 22, 20, 30.

  2. 1 mark

    M1 for the median (40th value) identified in the \(30 < d \leqslant 35\) class, with 30 people before it

    Running totals 8, 30, 50. Accept the 40.5th value.

  3. 1 mark

    M1 for \(30 + \dfrac{10}{20} \times 5\) oe

    Or 10 ÷ 4 = 2.5 (10 people at a frequency density of 4). With the 40.5th value: \(30 + \dfrac{10.5}{20} \times 5\).

  4. 1 mark

    A1 for 32.5

    Accept 32.5 to 32.7 (32.625 from the 40.5th value).

Ready to try the rest? Every answer you write is marked against the mark scheme, so you can see exactly where the marks are.

Study Helper Hints first, answers after you try

Stuck on this one? Ask for a hint and I’ll point you in the right direction, without giving the answer away. Once you’ve checked your answer, I’ll show you how the marks are awarded.