Level:
Correct: 0
Incorrect: 0
Marks: 0/0
Exam Practice
Course:
Topics:
OCR GCSE Maths (Higher non-calculator) Smart practice A mixed round aimed at your weak spots
Unit 1
Number Operations and Integers
Unit 2
Fractions, Decimals and Percentages
Unit 3
Indices and Surds
Unit 4
Approximation and Estimation
Unit 5
Ratio, Proportion and Rates of Change
Unit 6
Algebra
Unit 7
Graphs of Equations and Functions
Unit 8
Basic Geometry
Unit 9
Congruence and Similarity
Unit 10
Mensuration
Unit 11
Probability
Unit 12
Statistics
Avg
score:
–
Topics
done:
0/121

Charts, tables and time series graphs

Practise 14 exam-style questions on Charts, tables and time series graphs for OCR GCSE Maths (Higher non-calculator). Write your answer as you would in the exam and get it marked in seconds against the mark scheme, point by point, with the Study Helper on hand if you get stuck.

  • 14 questions
  • 1–4 marks each
  • Instant marking
  • No sign-up needed
14 questions, marked as you go

Sample questions with model answers

Here are 4 of the questions in this topic, each with a model answer, an explanation of why it earns the marks and the mark scheme an examiner would use.

Question 1

2 marks

180 people were asked to choose their favourite sport.
The pie chart shows the results.

How many people chose rugby?
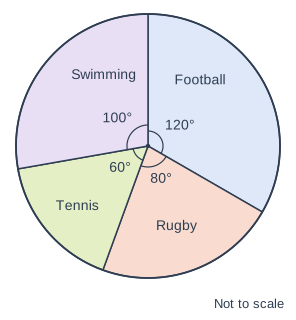
Pie chart. A circle divided into sectors, drawn clockwise from the top (12 o'clock): Football, 120° (printed); Rugby, 80° (printed); Tennis, 60° (printed); Swimming, 100° (printed). Each printed angle is marked with a small arc at the centre. It is marked "Not to scale".

Model answer

360° represents 180 people, so 1 person is represented by 2°.
Rugby: 80 ÷ 2 = 40 people

Explanation

The whole pie (360°) stands for all 180 people, so each person is 2° of the pie. Divide the rugby angle by 2. A common error is to read the angle (80) as the number of people.

Mark scheme
  1. 1 mark

    M1 for \(\dfrac{80}{360} \times 180\) oe

    Or 180 ÷ 360 = 0.5 person per degree, or 360 ÷ 180 = 2° per person and 80 ÷ 2; correct answer with no working scores full marks

  2. 1 mark

    A1 for 40

Question 2

2 marks

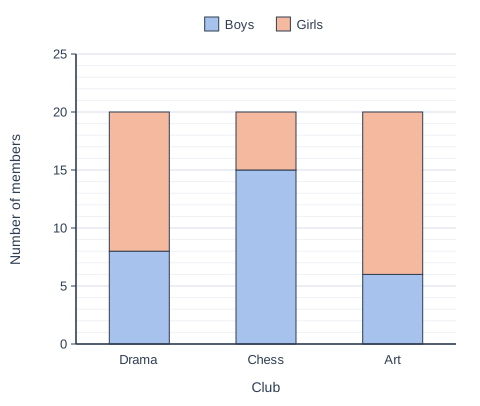
The composite bar chart shows the numbers of boys and girls in three school clubs.

What percentage of the members of the drama club are girls?

Stacked bar chart with 3 vertical bars. The value axis (y-axis) is "Number of members", from 0 to 25 marked every 5; the bars are labelled along the x-axis, "Club", from left to right. Each bar is split into 2 parts, shown in the key: Boys (bottom, blue) and Girls (top, orange). Values: Drama: boys 8, girls 12; Chess: boys 15, girls 5; Art: boys 6, girls 14. The values are not printed on the bars; they are read from the scale.

Model answer

Drama club: boys 8, girls 20 − 8 = 12, total 20
Percentage of girls = \(\dfrac{12}{20} \times 100 = 60\%\)

Explanation

In a composite bar chart each bar is split into parts. The girls' part starts at 8 and ends at 20, so there are 20 − 8 = 12 girls, not 20. A common error is to read the top of the girls' part as the number of girls.

Mark scheme
  1. 1 mark

    M1 for \(\dfrac{12}{20}\) oe

    The girls in drama over the total in drama; correct answer with no working scores full marks

  2. 1 mark

    A1 for 60

    Accept 60%. 40 (the percentage of boys) scores M0 A0. \(\dfrac{20}{12}\) scores 0.

Question 3

2 marks

Ben measures the heights of 30 students in his class.

He says,

'I will show the heights in a pie chart, with one sector for each student.'

Explain why a pie chart is not suitable, and suggest how Ben should organise and display the heights.

Model answer

A pie chart shows how a whole is shared between categories. Height is continuous numerical data, and 30 sectors (one per student) would not show how the heights are distributed.
Ben should group the heights into classes, such as 150 < h ≤ 155, in a grouped frequency table, and draw a histogram (or frequency diagram).

Explanation

Choose a diagram that suits the type of data. Pie charts, bar charts and pictograms suit categorical data; continuous data such as height should be grouped into classes without gaps and shown in a histogram, frequency diagram or frequency polygon. A stem-and-leaf diagram also works for 30 values.

Mark scheme
  1. 1 mark

    B1 for a correct reason, e.g. height is continuous numerical data / a pie chart with 30 sectors would not show the distribution of the heights / pie charts are for categorical data

    Do not accept 'it would be too hard to draw' alone.

  2. 1 mark

    B1 for group the heights into classes in a grouped frequency table and display them in a histogram or frequency diagram (or frequency polygon)

    Accept a stem-and-leaf diagram. The grouping (or a stem-and-leaf diagram) must be mentioned. Do not accept 'a bar chart' alone or 'a pictogram'.

Question 4

4 marks

There are 80 students in Year 9.
Each student studies either French or Spanish.

46 of the students are girls.
21 of the boys study French.
35 of the students study Spanish.

Work out the number of girls who study French.

Model answer

Two-way table:
Boys: 80 − 46 = 34; French 21, Spanish 34 − 21 = 13
Girls: 46; Spanish 35 − 13 = 22, French 46 − 22 = 24
Check: French total = 21 + 24 = 45 = 80 − 35
24 girls study French.

Explanation

Set up a two-way table with rows for boys and girls and columns for French and Spanish, then fill in whatever can be worked out from the totals. The quickest route is French total = 80 − 35 = 45, so girls studying French = 45 − 21 = 24. Checking that the rows and columns add up catches errors.

Mark scheme
  1. 1 mark

    M1 for 80 − 46 = 34 (boys) or 80 − 35 = 45 (French)

    May be seen in a two-way table; correct answer with no working scores full marks

  2. 1 mark

    M1 for their 34 − 21 = 13 (boys who study Spanish)

    On the route 80 − 35 = 45 (French total) then 45 − 21, this mark is implied by their 45 − 21 (the route has only two steps).

  3. 1 mark

    M1 for 35 − their 13 = 22 (girls who study Spanish), or their 45 − 21

  4. 1 mark

    A1 for 24

    A correct answer from any correct method scores 4 marks, e.g. 80 − 35 = 45 and 45 − 21 = 24, or a correct two-way table.

Ready to try the rest? Every answer you write is marked against the mark scheme, so you can see exactly where the marks are.

Study Helper Hints first, answers after you try

Stuck on this one? Ask for a hint and I’ll point you in the right direction, without giving the answer away. Once you’ve checked your answer, I’ll show you how the marks are awarded.