Level:
Correct: 0
Incorrect: 0
Marks: 0/0
Exam Practice
Course:
Topics:
OCR GCSE Maths (Higher non-calculator) Smart practice A mixed round aimed at your weak spots
Unit 1
Number Operations and Integers
Unit 2
Fractions, Decimals and Percentages
Unit 3
Indices and Surds
Unit 4
Approximation and Estimation
Unit 5
Ratio, Proportion and Rates of Change
Unit 6
Algebra
Unit 7
Graphs of Equations and Functions
Unit 8
Basic Geometry
Unit 9
Congruence and Similarity
Unit 10
Mensuration
Unit 11
Probability
Unit 12
Statistics
Avg
score:
–
Topics
done:
0/121

Histograms and cumulative frequency

Practise 20 exam-style questions on Histograms and cumulative frequency for OCR GCSE Maths (Higher non-calculator). Write your answer as you would in the exam and get it marked in seconds against the mark scheme, point by point, with the Study Helper on hand if you get stuck.

  • 20 questions
  • 2–5 marks each
  • Instant marking
  • No sign-up needed
20 questions, marked as you go

Sample questions with model answers

Here are 4 of the questions in this topic, each with a model answer, an explanation of why it earns the marks and the mark scheme an examiner would use.

Question 1

2 marks

The histogram shows information about the lengths, in minutes, of some phone calls.

Work out the number of calls that lasted between 10 minutes and 20 minutes.
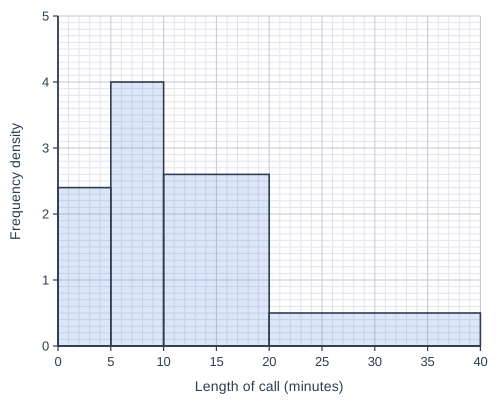
Histogram drawn on a grid of small squares. The horizontal axis is "Length of call (minutes)", from 0 to 40, numbered every 5, with 5 small squares between numbered values (each small square is 1). The vertical axis is "Frequency density", from 0 to 5, numbered every 1, with 10 small squares between numbered values (each small square is 0.1). The bars touch, with no gaps between them. Bars: from 0 to 5, height 2.4; from 5 to 10, height 4; from 10 to 20, height can be read from the grid; from 20 to 40, height 0.5.

Model answer

The bar for 10 to 20 minutes has frequency density 2.6.
Frequency = frequency density × class width = 2.6 × 10 = 26 calls

Explanation

The vertical axis shows frequency density, not frequency. The number of calls in a class is the area of its bar: frequency density × class width. A common error is to give the height of the bar as the answer.

Mark scheme
  1. 1 mark

    M1 for 2.6 × 10 oe

    Frequency = frequency density × class width. Allow a reading within one small square (2.5 to 2.7); correct answer with no working scores full marks

  2. 1 mark

    A1 for 26

    2.6 (the height of the bar) scores M0 A0.
Question 2

2 marks

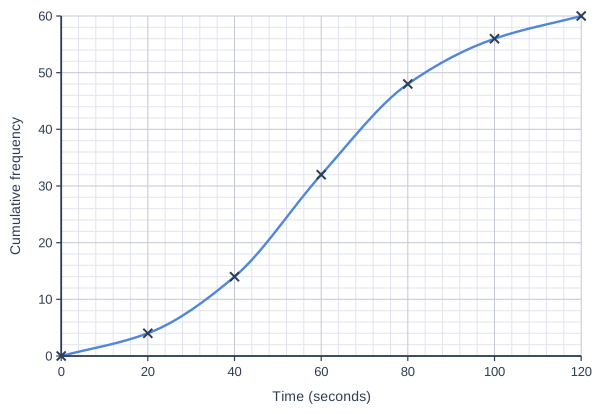
The cumulative frequency graph shows information about the times, in seconds, that 60 students took to solve a puzzle.

Ben says,

'More than half of the students took less than 50 seconds.'

Is Ben correct?
Give a reason for your answer.

Cumulative frequency graph on a grid of small squares. The horizontal axis is "Time (seconds)", from 0 to 120, numbered every 20, with 5 small squares between numbered values (each small square is 4). The vertical axis is "Cumulative frequency", from 0 to 60, numbered every 10, with 5 small squares between numbered values (each small square is 2). A smooth curve starts at (0, 0) and passes through (20, 4), (40, 14), (60, 32), (80, 48), (100, 56) and (120, 60) (each point is marked with a cross).

Model answer

Half of 60 students is 30.
Reading at 50 seconds: cumulative frequency ≈ 22.
Only about 22 students took less than 50 seconds, which is fewer than 30.
So Ben is not correct.

Explanation

Either read the number of students who took up to 50 seconds and compare it with half the total, or read the median (at a cumulative frequency of 30) and compare it with 50 seconds. Both show that fewer than half took less than 50 seconds.

Mark scheme
  1. 1 mark

    B1 for a correct reading: cumulative frequency at 50 seconds ≈ 22, or median ≈ 58 seconds

    Accept 20 to 25 for the cumulative frequency, or 54 to 62 for the median.

  2. 1 mark

    B1 for No, with a correct comparison

    e.g. 'about 22 students took less than 50 seconds, which is less than 30 (half)' or 'the median is about 58 seconds, more than 50'. 'No' with no reason scores 0.

Question 3

3 marks

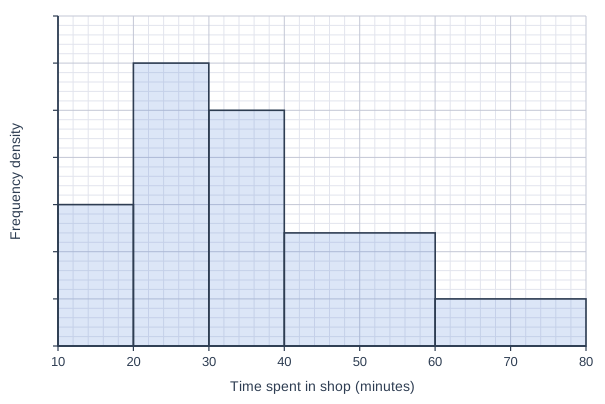
The histogram shows information about the times that some customers spent in a shop.

30 customers spent between 20 and 30 minutes in the shop.

Work out the number of customers who spent between 40 and 60 minutes in the shop.

Histogram drawn on a grid of small squares. The horizontal axis is "Time spent in shop (minutes)", from 10 to 80, numbered every 10, with 5 small squares between numbered values (each small square is 2). The vertical axis is "Frequency density"; it has tick marks every 5 small squares but no numbers. The bars touch, with no gaps between them. Bars: from 10 to 20 (5 small squares wide), 15 small squares tall; from 20 to 30 (5 small squares wide), 30 small squares tall; from 30 to 40 (5 small squares wide), 25 small squares tall; from 40 to 60 (10 small squares wide), 12 small squares tall; from 60 to 80 (10 small squares wide), 5 small squares tall.

Model answer

The 20 to 30 bar is 30 small squares tall and its frequency density is 30 ÷ 10 = 3.
So each small square up the axis is 0.1.
The 40 to 60 bar is 12 small squares tall, so its frequency density is 1.2.
Frequency = 1.2 × 20 = 24 customers

Explanation

When the frequency density axis has no numbers, use the class you know to work out the scale. You can do this with frequency densities, as here, or by counting areas: the 20 to 30 bar covers 150 small squares for 30 customers, so 5 small squares stand for 1 customer, and the 40 to 60 bar covers 120 small squares, which is 24 customers. A common error is to compare heights only, ignoring the different widths.

Mark scheme
  1. 1 mark

    M1 for a correct scale from the 20 to 30 bar

    e.g. frequency density 30 ÷ 10 = 3, so the bar 30 small squares tall represents 3 and each small square up is 0.1; or the bar's area of 150 small squares represents 30 customers, so 5 small squares represent 1 customer; correct answer with no working scores full marks

  2. 1 mark

    M1 for 1.2 × 20 or 120 ÷ 5 oe

    The 40 to 60 bar: height 12 small squares = frequency density 1.2; area 10 × 12 = 120 small squares.

  3. 1 mark

    A1 for 24

Question 4

4 marks

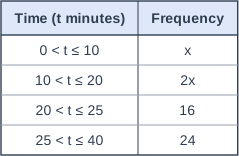
The table shows information about the times, t minutes, taken by some students to walk to school.

The total frequency is 100.

Work out the frequency density of the \(10 < t \leqslant 20\) class.

Table with columns "Time (t minutes)", "Frequency". Time (t minutes): 0 < t ≤ 10; Frequency: x | Time (t minutes): 10 < t ≤ 20; Frequency: 2x | Time (t minutes): 20 < t ≤ 25; Frequency: 16 | Time (t minutes): 25 < t ≤ 40; Frequency: 24.

Model answer

x + 2x + 16 + 24 = 100
3x + 40 = 100
3x = 60
x = 20
Frequency of \(10 < t \leqslant 20\) = 2x = 40
Frequency density = 40 ÷ 10 = 4

Explanation

Use the total frequency to form and solve an equation for x. The class \(10 < t \leqslant 20\) has frequency 2x, not x, and frequency density = frequency ÷ class width. Forgetting to double, or dividing by the wrong width, are the common errors.

Mark scheme
  1. 1 mark

    M1 for x + 2x + 16 + 24 = 100 oe

    Or 3x = 60; correct answer with no working scores full marks

  2. 1 mark

    A1 for x = 20

  3. 1 mark

    M1 for 2 × their 20 ÷ 10

  4. 1 mark

    A1 for 4

    2 (x ÷ 10, using x instead of 2x) scores M1 A1 M0 A0.

Ready to try the rest? Every answer you write is marked against the mark scheme, so you can see exactly where the marks are.

Study Helper Hints first, answers after you try

Stuck on this one? Ask for a hint and I’ll point you in the right direction, without giving the answer away. Once you’ve checked your answer, I’ll show you how the marks are awarded.