Level:
Correct: 0
Incorrect: 0
Marks: 0/0
Exam Practice
Course:
Topics:
OCR GCSE Maths (Higher non-calculator) Smart practice A mixed round aimed at your weak spots
Unit 1
Number Operations and Integers
Unit 2
Fractions, Decimals and Percentages
Unit 3
Indices and Surds
Unit 4
Approximation and Estimation
Unit 5
Ratio, Proportion and Rates of Change
Unit 6
Algebra
Unit 7
Graphs of Equations and Functions
Unit 8
Basic Geometry
Unit 9
Congruence and Similarity
Unit 10
Mensuration
Unit 11
Probability
Unit 12
Statistics
Avg
score:
–
Topics
done:
0/121

Area under a graph

Practise 14 exam-style questions on Area under a graph for OCR GCSE Maths (Higher non-calculator). Write your answer as you would in the exam and get it marked in seconds against the mark scheme, point by point, with the Study Helper on hand if you get stuck.

  • 14 questions
  • 2–5 marks each
  • Instant marking
  • No sign-up needed
14 questions, marked as you go

Sample questions with model answers

Here are 4 of the questions in this topic, each with a model answer, an explanation of why it earns the marks and the mark scheme an examiner would use.

Question 1

2 marks

Leah wants to estimate the distance a sprinter runs in the first 5 seconds of a race.
The graph shows the sprinter's velocity.

Leah splits the area under the graph into 5 trapezia of equal width.

Will her estimate be an overestimate or an underestimate of the distance?
Give a reason for your answer.
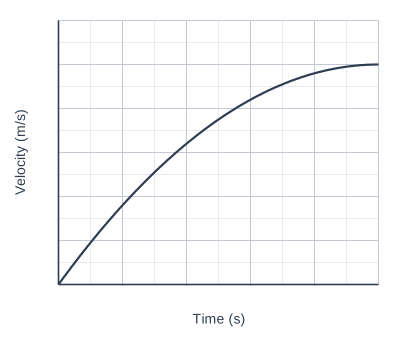
A graph of Velocity (m/s) (vertical axis, 0 to 12, marked every 2) against Time (s) (horizontal axis, 0 to 5, marked every 1), on a grid with 2 small squares to each large square. The curve is an upside-down U-shaped (∩-shaped) parabola: it crosses the x-axis at (0, 0).

Model answer

Underestimate.
The graph curves downwards (it gets less steep), so each straight line joining two points on the curve lies below the curve.
The trapezia leave out small pieces of area between their tops and the curve.

Explanation

The top of each trapezium is a chord joining two points on the curve. When the curve bends downwards (like this one), every chord lies below the curve, so the trapezia leave gaps and the total is too small. When a curve bends upwards, the chords lie above it and the trapezium estimate is too large.

Mark scheme
  1. 1 mark

    B1 for underestimate

  2. 1 mark

    B1 for a correct reason, e.g. the curve bends downwards so the tops of the trapezia are below the curve / the trapezia miss small areas between their tops and the curve

    Accept 'the curve is concave' oe or a correct description of a sketch. Do not accept 'the trapezia do not fit the curve exactly' without saying the trapezia are below it.
Question 2

3 marks

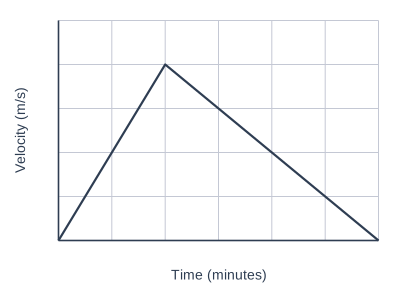
The graph shows the velocity of a tram between two stops.

Ben works out the distance between the stops.

Area = \(\dfrac{1}{2} \times 6 \times 20 = 60\)
So the distance is 60 m.

Ben's answer is wrong.
Explain the mistake Ben has made and work out the correct distance.

A graph of Velocity (m/s) (vertical axis, 0 to 25, marked every 5) against Time (minutes) (horizontal axis, 0 to 6, marked every 1), on a grid. The graph is made of straight-line sections joining (0, 0), (2, 20) and (6, 0).

Model answer

Ben's mistake: the time on the graph is in minutes, but the velocity is in metres per second. He must change the time into seconds.
6 minutes = 360 seconds
Distance = \(\dfrac{1}{2} \times 360 \times 20 = 3600\) m

Explanation

The area under a velocity-time graph gives distance only if the units match: m/s multiplied by seconds gives metres. Here the time axis is in minutes, so either convert 6 minutes to 360 seconds or convert 20 m/s to 1200 metres per minute. Ben's answer is 60 times too small.

Mark scheme
  1. 1 mark

    B1 for the time is in minutes but the velocity is in metres per second (so the units are not consistent)

    Accept 'he did not change 6 minutes into seconds' oe. Do not accept 'he used the wrong formula'.

  2. 1 mark

    M1 for \(\dfrac{1}{2} \times 360 \times 20\) oe

    Or 60 × 60. Any correct conversion of the units, e.g. 20 m/s = 1200 m per minute and \(\dfrac{1}{2} \times 6 \times 1200\).

  3. 1 mark

    A1 for 3600

    Accept 3600 m or 3.6 km. 3600 with no units is condoned.

Question 3

4 marks

Water flows into an empty tank.
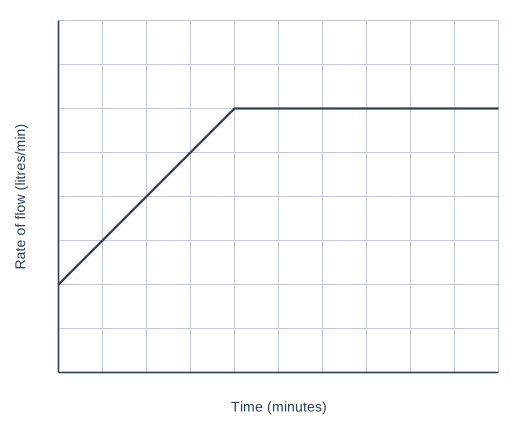
The graph shows the rate of flow, in litres per minute, for the first 10 minutes.

The tank holds 300 litres.
After 10 minutes, the water keeps flowing in at 30 litres per minute until the tank is full.

Work out how many more minutes it takes to fill the tank.

A graph of Rate of flow (litres/min) (vertical axis, 0 to 40, marked every 5) against Time (minutes) (horizontal axis, 0 to 10, marked every 1), on a grid. The graph is made of straight-line sections joining (0, 10), (4, 30) and (10, 30).

Model answer

Volume = area under the rate-time graph
First 4 minutes (trapezium): \(\dfrac{1}{2} \times (10 + 30) \times 4 = 80\) litres
Next 6 minutes (rectangle): \(6 \times 30 = 180\) litres
Volume after 10 minutes = 80 + 180 = 260 litres
Still needed: 300 − 260 = 40 litres
Time = 40 ÷ 30 = \(1\dfrac{1}{3}\) minutes (1 minute 20 seconds)

Explanation

When the vertical axis is a rate (litres per minute) and the horizontal axis is time (minutes), the area under the graph is the total amount (litres). Find the volume after 10 minutes, then the volume still needed, and divide by the flow rate. Reading 30 from the graph and working out 30 × 10 = 300 ignores the slower start.

Mark scheme
  1. 1 mark

    M1 for a correct method for the area under the graph

    e.g. \(\dfrac{1}{2} \times (10 + 30) \times 4 + 6 \times 30\), or \(4 \times 10 + \dfrac{1}{2} \times 4 \times 20 + 6 \times 30\); correct answer with no working scores full marks

  2. 1 mark

    A1 for 260

    The volume in litres after 10 minutes.

  3. 1 mark

    M1 for (300 − their 260) ÷ 30

    Their 260 must come from an attempt at the area under the graph.

  4. 1 mark

    A1 for \(1\dfrac{1}{3}\) minutes

    Accept \(\dfrac{4}{3}\), 1 minute 20 seconds, 80 seconds, or 1.33 or better. Do not accept 1.3 or 1.20 minutes.

Question 4

4 marks

At time t = 0 seconds, a car starts from rest at a set of traffic lights and accelerates at a constant rate.
At the same moment, a van passes the car, travelling at a constant velocity of 15 m/s.

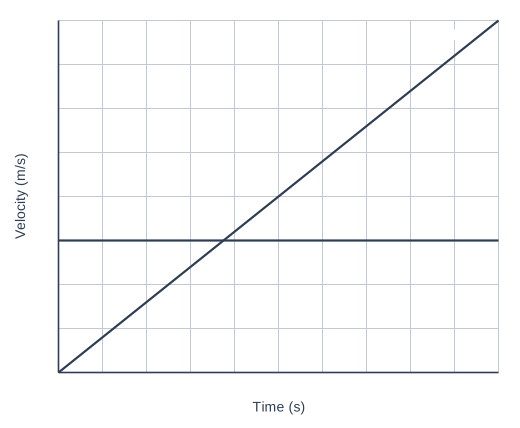
The graph shows the velocity of the car and the velocity of the van.

Work out the time at which the car catches up with the van.

A graph of Velocity (m/s) (vertical axis, 0 to 40, marked every 5) against Time (s) (horizontal axis, 0 to 20, marked every 2), on a grid. Graph Car is a straight line joining (0, 0) and (20, 40). Graph Van is a straight line joining (0, 15) and (20, 15). Graph Car and graph Van cross at (7.5, 15).

Model answer

From the graph, the car's velocity is 20 m/s after 10 s, so its acceleration is 2 m/s² and its velocity at time t is 2t.
Distance travelled by the car = area of triangle = \(\dfrac{1}{2} \times t \times 2t = t^2\)
Distance travelled by the van = area of rectangle = 15t
The car catches the van when \(t^2 = 15t\)
t = 15 seconds (t = 0 is the start)

Explanation

The car catches the van when they have travelled the same distance, so the areas under the two graphs must be equal. Where the lines cross (t = 7.5 s) the velocities are equal, but the van is still ahead because it was faster before that. Writing each area in terms of t, or trying values, gives t = 15 s, when both have travelled 225 m.

Mark scheme
  1. 1 mark

    M1 for the car's velocity at time t being 2t (gradient 2) soi

    e.g. read from the graph: 20 m/s at 10 s; correct answer with no working scores full marks

  2. 1 mark

    M1 for the distances: car \(\dfrac{1}{2} \times t \times 2t = t^2\) and van 15t

    Or correct areas for a trial value, e.g. at t = 10: car 100 m, van 150 m.

  3. 1 mark

    M1 for \(t^2 = 15t\) oe, or a trial showing equal distances

    e.g. at t = 15: car \(\dfrac{1}{2} \times 15 \times 30 = 225\), van 15 × 15 = 225.

  4. 1 mark

    A1 for 15

    Accept 15 seconds. 7.5 (where the lines cross, when the velocities are equal) scores 0. t = 0 as well as 15 is condoned if 15 is given as the answer.

Ready to try the rest? Every answer you write is marked against the mark scheme, so you can see exactly where the marks are.

Study Helper Hints first, answers after you try

Stuck on this one? Ask for a hint and I’ll point you in the right direction, without giving the answer away. Once you’ve checked your answer, I’ll show you how the marks are awarded.