
Level:
Correct: 0
Incorrect: 0
Marks: 0/0
Exam Practice
Subject:
Topics:
Edexcel GCSE Maths (Non-calculator) Smart practice A mixed round aimed at your weak spots
Unit 1
Number
Unit 2
Algebra
Unit 3
Ratio, proportion and rates of change
Unit 4
Geometry and measures
Unit 5
Probability
Unit 6
Statistics
Avg
score:
–
Topics
done:
0/97

Using statistics to describe a population

Practise 18 exam-style questions on Using statistics to describe a population for Edexcel GCSE Maths (Non-calculator). Write your answer as you would in the exam and get it marked in seconds against the mark scheme, point by point, with an AI tutor on hand if you get stuck.

  • 18 questions
  • 1–5 marks each
  • Instant marking
  • No sign-up needed
18 questions, marked as you go

Sample questions with model answers

Here are 4 of the questions in this topic, each with a model answer, an explanation of why it earns the marks and the mark scheme an examiner would use.

Question 1

2 marks

The box plot shows information about the annual salaries of the 600 employees of a company.

Work out an estimate for the number of employees who earn more than £28 000.
Work out an estimate for the number of employees who earn between £22 000 and £28 000.
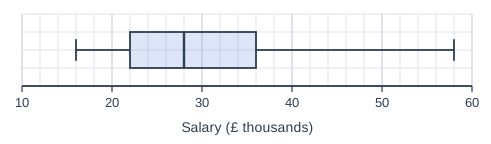
A box plot drawn above a horizontal scale "Salary (£ thousands)" from 10 to 60, numbered every 10, with 5 small squares between numbered values (each small square is 2), on a grid of small squares. The box plot: lowest value (left end of the left whisker) 16; lower quartile (left side of the box) 22; median (line inside the box) 28; upper quartile (right side of the box) 36; highest value (right end of the right whisker) 58.

Model answer

£28 000 is the median, so half of the employees earn more: \(\dfrac{1}{2} \times 600 = 300\)
£22 000 is the lower quartile, so a quarter of the employees earn between £22 000 and £28 000: \(\dfrac{1}{4} \times 600 = 150\)

Explanation

The quartiles and the median split a population into four equal parts. Above the median is half of the population, and between the lower quartile and the median is a quarter. The scale is in thousands of pounds.

Mark scheme
  1. 1 mark

    B1 for 300

    £28 000 is the median, so half of 600; correct answer with no working scores full marks

  2. 1 mark

    B1 for 150

    from the lower quartile to the median is a quarter of 600
Question 2

2 marks

The median house price in a town rose from £200 000 in 2020 to £230 000 in 2025.
A newspaper says,
"Half of the houses in the town now cost more than £230 000, and the price of every house in the town has gone up by 15%."

Which part of the newspaper's statement is supported by the statistics, and which part is not? Explain your answer.

Model answer

'Half of the houses now cost more than £230 000' is supported, because the median is the middle price.
'Every house has gone up by 15%' is not supported. The median rose by \(\dfrac{30\,000}{200\,000} = 15\%\), but the median is only one value: individual house prices could have changed by different amounts.

Explanation

An average summarises a whole population, so it can tell you about the population (half the houses are above the median) but not about every individual member of it.

Mark scheme
  1. 1 mark

    B1 for the first part is supported: £230 000 is the median, so about half of the houses cost more

  2. 1 mark

    C1 for the second part is not supported: the median rose by 15%, but that does not mean every house price rose by 15% (some may have risen more, less, or fallen)

Question 3

3 marks

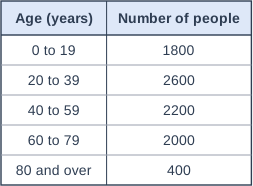
The table shows information about the ages of all 9000 people living in a town.

The council says,
"More than a quarter of the people in our town are aged 60 or over."

Is the council correct?
You must show how you get your answer.

Table with columns "Age (years)", "Number of people". Age (years): 0 to 19; Number of people: 1800 | Age (years): 20 to 39; Number of people: 2600 | Age (years): 40 to 59; Number of people: 2200 | Age (years): 60 to 79; Number of people: 2000 | Age (years): 80 and over; Number of people: 400.

Model answer

People aged 60 or over \(= 2000 + 400 = 2400\)
A quarter of the population \(= 9000 \div 4 = 2250\)
2400 is more than 2250 (it is about 26.7%), so the council is correct.

Explanation

Add the age groups that are 60 or over, then compare with a quarter of the whole population. Comparing numbers of people or percentages both work.

Mark scheme
  1. 1 mark

    M1 for 2000 + 400 (= 2400) people aged 60 or over

  2. 1 mark

    M1 for comparing with a quarter, e.g. 9000 ÷ 4 = 2250, or \(\dfrac{2400}{9000} \times 100\) (= 26.7%)

  3. 1 mark

    C1 for Yes, with correct figures, e.g. 2400 > 2250

Question 4

4 marks

In 2015, the population of a town was 24 000. The mean number of people in each household was 2.4.
By 2025, the population had increased by 15%. The mean number of people in each household had fallen to 2.3.

Work out how many more households there were in the town in 2025 than in 2015.

Model answer

Households in 2015 \(= 24\,000 \div 2.4 = 10\,000\)
Population in 2025 \(= 24\,000 \times 1.15 = 27\,600\)
Households in 2025 \(= 27\,600 \div 2.3 = 12\,000\)
Increase \(= 12\,000 - 10\,000 = 2000\) households

Explanation

Mean household size = population ÷ number of households, so the number of households = population ÷ mean household size. Work out the number for each year and subtract. Both the bigger population and the smaller households increase the number of households.

Mark scheme
  1. 1 mark

    P1 for 24 000 ÷ 2.4 (= 10 000) households in 2015

    correct answer with no working scores full marks

  2. 1 mark

    P1 for the 2025 population 24 000 × 1.15 (= 27 600)

  3. 1 mark

    P1 for 27 600 ÷ 2.3 (= 12 000) households in 2025

    ft their population

  4. 1 mark

    A1 for 2000

    cao

Ready to try the rest? Every answer you write is marked against the mark scheme, so you can see exactly where the marks are.

AI Tutor Hints first, answers after you try

Hi! Stuck? Ask me for a hint and I’ll help you work it out. Once you’ve checked your answer I can explain exactly where the marks are.