Level:
Correct: 0
Incorrect: 0
Marks: 0/0
Exam Practice
Subject:
Topics:
Edexcel GCSE Maths (Non-calculator) Smart practice A mixed round aimed at your weak spots
Unit 1
Number
Unit 2
Algebra
Unit 3
Ratio, proportion and rates of change
Unit 4
Geometry and measures
Unit 5
Probability
Unit 6
Statistics
Avg
score:
–
Topics
done:
0/97

Averages, spread and box plots

Practise 36 exam-style questions on Averages, spread and box plots for Edexcel GCSE Maths (Non-calculator). Write your answer as you would in the exam and get it marked in seconds against the mark scheme, point by point, with an AI tutor on hand if you get stuck.

  • 36 questions
  • 1–5 marks each
  • Instant marking
  • No sign-up needed
20 questions, marked as you go

Sample questions with model answers

Here are 4 of the questions in this topic, each with a model answer, an explanation of why it earns the marks and the mark scheme an examiner would use.

Question 1

2 marks

The mean of five numbers is 8.
Four of the numbers are 6, 9, 11 and 4.

Work out the fifth number.

Model answer

Total of the five numbers \(= 5 \times 8 = 40\)
Total of the four numbers \(= 6 + 9 + 11 + 4 = 30\)
Fifth number \(= 40 - 30 = 10\)

Explanation

The mean is the total divided by how many numbers there are, so the total of all five numbers is 5 × 8. Subtract the four known numbers from this total to find the missing one.

Mark scheme
  1. 1 mark

    M1 for 5 × 8 (= 40), or 40 − (6 + 9 + 11 + 4)

    correct answer with no working scores full marks

  2. 1 mark

    A1 for 10

    cao

Question 2

2 marks

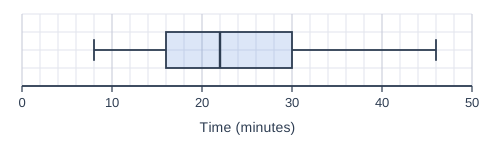
The box plot shows information about the times that the students in Year 11 took to complete a puzzle.

What percentage of the students took more than 30 minutes?

A box plot drawn above a horizontal scale "Time (minutes)" from 0 to 50, numbered every 10, with 5 small squares between numbered values (each small square is 2), on a grid of small squares. The box plot: lowest value (left end of the left whisker) 8; lower quartile (left side of the box) 16; median (line inside the box) 22; upper quartile (right side of the box) 30; highest value (right end of the right whisker) 46.

Model answer

The right-hand end of the box is at 30 minutes, so 30 minutes is the upper quartile.
A quarter of the students are above the upper quartile, so 25% took more than 30 minutes.

Explanation

A box plot splits the data into four parts with (roughly) equal numbers of values: lowest value to lower quartile, lower quartile to median, median to upper quartile, and upper quartile to highest value. Each part holds 25% of the data, however long it looks.

Mark scheme
  1. 1 mark

    M1 for identifying 30 minutes as the upper quartile

    correct answer with no working scores full marks

  2. 1 mark

    A1 for 25%

    accept \(\dfrac{1}{4}\)

Question 3

3 marks

The mean age of a group of 6 people is 24 years.
Another person joins the group. The mean age of the 7 people is now 25 years.

Work out the age of the person who joined the group.

Model answer

Total age of the 6 people \(= 6 \times 24 = 144\)
Total age of the 7 people \(= 7 \times 25 = 175\)
Age of the new person \(= 175 - 144 = 31\) years

Explanation

Work with totals: mean × number of people gives the total. The difference between the two totals is the age of the person who joined. Note the answer is not 25 or 26: the new person has to raise the mean of all seven by 1 year.

Mark scheme
  1. 1 mark

    M1 for 6 × 24 (= 144)

    correct answer with no working scores full marks

  2. 1 mark

    M1 for 7 × 25 (= 175)

  3. 1 mark

    A1 for 31

    cao

Question 4

4 marks

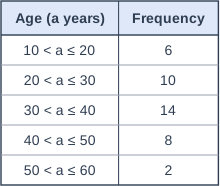
The table shows information about the ages, a years, of 40 members of a club.
Zak works out an estimate for the mean age. He uses the values 20, 30, 40, 50 and 60 for the five classes and gets 37.5 years.

Explain why Zak's estimate is likely to be too big, and work out a better estimate for the mean age.

Table with columns "Age (a years)", "Frequency". Age (a years): 10 < a ≤ 20; Frequency: 6 | Age (a years): 20 < a ≤ 30; Frequency: 10 | Age (a years): 30 < a ≤ 40; Frequency: 14 | Age (a years): 40 < a ≤ 50; Frequency: 8 | Age (a years): 50 < a ≤ 60; Frequency: 2.

Model answer

Zak has used the upper class boundaries, which are the largest possible ages in each class, so his estimate is too big.
Midpoints: 15, 25, 35, 45, 55
\(\sum fx = 6 \times 15 + 10 \times 25 + 14 \times 35 + 8 \times 45 + 2 \times 55 = 90 + 250 + 490 + 360 + 110 = 1300\)
Estimated mean \(= 1300 \div 40 = 32.5\) years

Explanation

The midpoint is the best single value to represent a class, because values in the class are expected to be spread either side of it. Using upper boundaries adds about half a class width (5 years) to every value, which is why Zak's answer is 5 years too big.

Mark scheme
  1. 1 mark

    C1 for he has used the upper class boundaries instead of the midpoints, so he has assumed every member is as old as possible in their class

  2. 1 mark

    M1 for at least three correct products of frequency × midpoint, e.g. 6 × 15, 10 × 25, 14 × 35

  3. 1 mark

    M1 for their Σfx ÷ 40, e.g. 1300 ÷ 40

  4. 1 mark

    A1 for 32.5 years

    cao

Ready to try the rest? Every answer you write is marked against the mark scheme, so you can see exactly where the marks are.

AI Tutor Hints first, answers after you try

Hi! Stuck? Ask me for a hint and I’ll help you work it out. Once you’ve checked your answer I can explain exactly where the marks are.