Practise 36 exam-style questions on Histograms and cumulative frequency for Edexcel GCSE Maths (Non-calculator). Write your answer as you would in the exam and get it marked in seconds against the mark scheme, point by point, with an AI tutor on hand if you get stuck.
36 questions
1–5 marks each
Instant marking
No sign-up needed
20 questions, marked as you go
Sample questions with model answers
Here are 4 of the questions in this topic, each with a model answer, an explanation of why it earns the marks and the mark scheme an examiner would use.
Question 1
2 marks
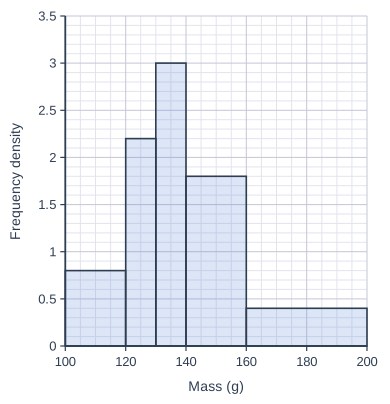
The histogram shows information about the masses of some apples.
Work out the number of apples with a mass between 140 g and 160 g.
Model answer
The bar from 140 to 160 has a frequency density of 1.8 and a width of 20 g. Frequency \(= 1.8 \times 20 = 36\) apples
Explanation
In a histogram the area of a bar gives the frequency: frequency = frequency density × class width. A common mistake is to give the height of the bar (1.8) as the frequency.
Mark scheme
1 mark
M1 for 1.8 × 20
frequency density × class width; correct answer with no working scores full marks
1 mark
A1 for 36
cao
Question 2
2 marks
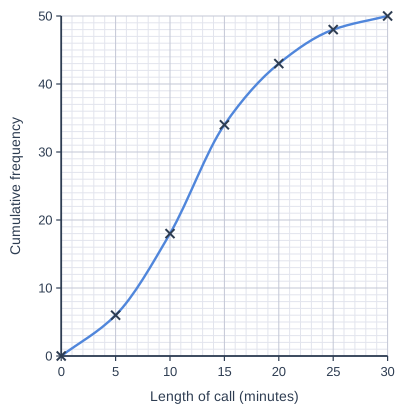
The cumulative frequency graph shows information about the lengths of 50 phone calls. The classes are 0 to 5 minutes, 5 to 10 minutes, and so on.
Use the graph to find the modal class.
Model answer
Cumulative frequencies at 5, 10, 15, 20, 25, 30: 6, 18, 34, 43, 48, 50 Frequencies: \(6\), \(18 - 6 = 12\), \(34 - 18 = 16\), \(43 - 34 = 9\), \(48 - 43 = 5\), \(50 - 48 = 2\) The greatest frequency is 16, so the modal class is 10 to 15 minutes.
Explanation
The frequency of each class is the increase in cumulative frequency across it. The modal class has the biggest increase, which is where the graph is steepest.
Mark scheme
1 mark
M1 for finding at least three class frequencies from differences in cumulative frequency, e.g. 6, 12, 16, 9, 5, 2
correct answer with no working scores full marks
1 mark
A1 for 10 to 15 minutes
accept 10 < t ≤ 15
Question 3
3 marks
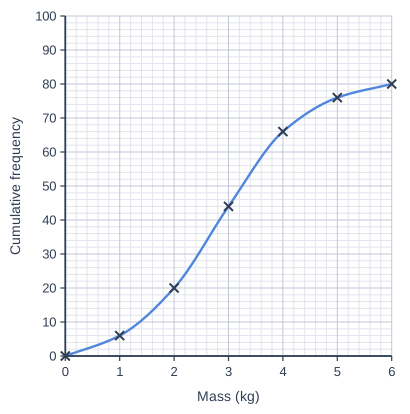
The cumulative frequency graph shows information about the masses of 80 parcels.
Use the graph to find an estimate for the number of parcels with a mass greater than 2.5 kg but not more than 4 kg.
Model answer
Cumulative frequency at 4 kg \(= 66\) Cumulative frequency at 2.5 kg \(\approx 31\) Number of parcels \(\approx 66 - 31 = 35\)
Explanation
Each reading tells you how many parcels have at most that mass. The number between two masses is the difference between the two cumulative frequencies.
Mark scheme
1 mark
M1 for reading the cumulative frequency at 4 kg as 66
correct answer with no working scores full marks
1 mark
M1 for reading the cumulative frequency at 2.5 kg, in the range 29 to 34
1 mark
A1 for an answer in the range 32 to 37
ft 66 − their reading at 2.5
Question 4
4 marks
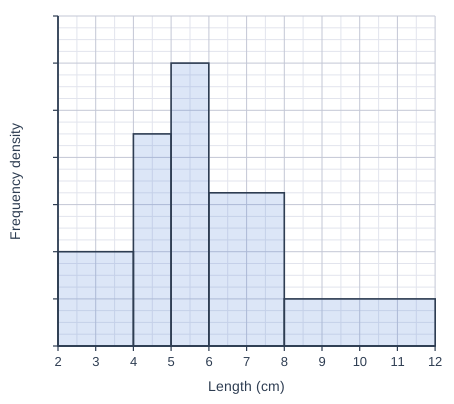
The histogram shows information about the lengths of 50 leaves. The frequency density axis has no numbers.
Work out the number of leaves with a length between 5 cm and 6 cm.
Model answer
Areas in small squares (width × height): 2 to 4: \(4 \times 8 = 32\); 4 to 5: \(2 \times 18 = 36\); 5 to 6: \(2 \times 24 = 48\); 6 to 8: \(4 \times 13 = 52\); 8 to 12: \(8 \times 4 = 32\) Total area \(= 200\) small squares, which represents 50 leaves. So 1 leaf is represented by \(200 \div 50 = 4\) small squares. Leaves from 5 cm to 6 cm \(= 48 \div 4 = 12\)
Explanation
Frequency is proportional to area in a histogram, so the total area of all the bars represents all 50 leaves. Working out what one small square represents lets you turn the area of any bar into a frequency.
Mark scheme
1 mark
P1 for finding the area of the bars in small squares: 32, 36, 48, 52, 32
at least three correct; any consistent unit of area is fine; correct answer with no working scores full marks
1 mark
P1 for the total area, 200 small squares
1 mark
P1 for a correct scale, e.g. 200 squares represent 50 leaves so 4 squares represent 1 leaf, or \(\dfrac{48}{200} \times 50\)
1 mark
A1 for 12
cao
Ready to try the rest? Every answer you write is marked against the mark scheme, so you can see exactly where the marks are.
Ctrl + Enter to check
AI TutorHints first, answers after you try
Hi! Stuck? Ask me for a hint and I’ll help you work it out. Once you’ve checked your answer I can explain exactly where the marks are.