Level:
Correct: 0
Incorrect: 0
Marks: 0/0
Exam Practice
Subject:
Topics:
Edexcel GCSE Maths (Non-calculator) Smart practice A mixed round aimed at your weak spots
Unit 1
Number
Unit 2
Algebra
Unit 3
Ratio, proportion and rates of change
Unit 4
Geometry and measures
Unit 5
Probability
Unit 6
Statistics
Avg
score:
–
Topics
done:
0/97

Real-life and non-standard graphs

Practise 28 exam-style questions on Real-life and non-standard graphs for Edexcel GCSE Maths (Non-calculator). Write your answer as you would in the exam and get it marked in seconds against the mark scheme, point by point, with an AI tutor on hand if you get stuck.

  • 28 questions
  • 1–5 marks each
  • Instant marking
  • No sign-up needed
20 questions, marked as you go

Sample questions with model answers

Here are 4 of the questions in this topic, each with a model answer, an explanation of why it earns the marks and the mark scheme an examiner would use.

Question 1

2 marks

The value, £\(V\), of a car \(t\) years after it was bought is given by
\[V = 20\,000 \times 0.8^t\]
Work out the value of the car 2 years after it was bought.

Model answer

\(V = 20\,000 \times 0.8^2 = 20\,000 \times 0.64 = 12\,800\)
The car is worth £12 800.

Explanation

The multiplier 0.8 means the car loses 20% of its value each year. After 2 years multiply by 0.8 twice, which is \(0.8^2 = 0.64\). A common error is to subtract 20% of the original value twice, giving £12 000.

Mark scheme
  1. 1 mark

    M1 for \(20\,000 \times 0.8^2\) or \(20\,000 \times 0.64\)

    or 20 000 × 0.8 = 16 000 then × 0.8; correct answer with no working scores full marks

  2. 1 mark

    A1 for £12 800

    cao

Question 2

2 marks

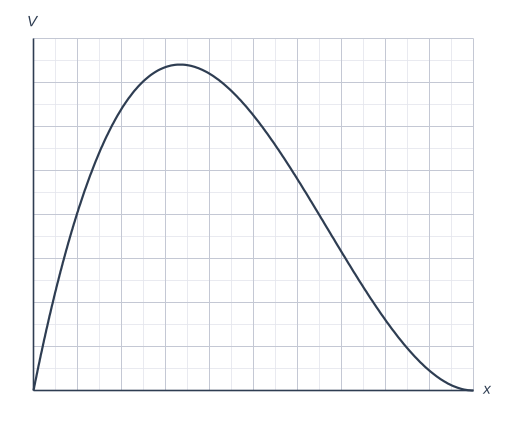
Squares of side \(x\) cm are cut from the corners of a square sheet of card 10 cm by 10 cm. The card is then folded to make an open box.
The volume of the box, \(V\) cm³, is \(V = x(10 - 2x)^2\).
The graph shows \(V\) for \(0 \le x \le 5\).

Use the graph to estimate the maximum volume of the box and the value of \(x\) that gives it.

A coordinate grid with x from 0 to 5 and V from 0 to 80; the x-axis is marked every 0.5 and the V-axis every 10 (with 2 small squares along each side of a large square), and the axes cross at the origin O. The curve is part of a cubic curve, rising to a maximum and then falling; its key points can be read from the grid.

Model answer

The highest point of the graph is at about \(x = 1.7\), where \(V \approx 74\).
The maximum volume is about 74 cm³, when \(x\) is about 1.7 cm.

Explanation

The maximum volume is the y-coordinate of the highest point of the curve, and the x-coordinate tells you the size of square to cut. This is a non-standard (cubic) function, so reading from the graph gives an approximate answer. Cutting very small or very large squares gives small volumes, which is why the curve rises and then falls.

Mark scheme
  1. 1 mark

    B1 for \(x\) in the range 1.6 to 1.8

    correct answer with no working scores full marks

  2. 1 mark

    B1 for a maximum volume in the range 72 to 76 cm³

Question 3

3 marks

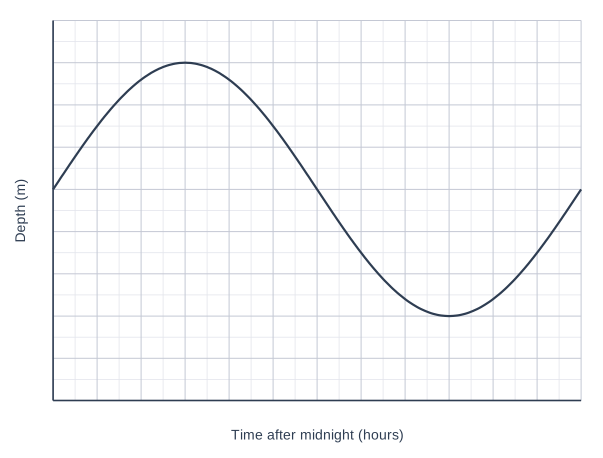
The depth of water, \(d\) metres, in a harbour \(t\) hours after midnight is given by \(d = 5 + 3\sin(30t)^\circ\).
The graph shows \(d\) for \(0 \le t \le 12\).

A boat can only enter the harbour when the depth is at least 6.5 m.
Use the graph to find between which times the boat can enter the harbour between midnight and noon.

A graph of Depth (m) (vertical axis, 0 to 9, marked every 1) against Time after midnight (hours) (horizontal axis, 0 to 12, marked every 1), on a grid with 2 small squares to each large square. The curve is a sine curve (a smooth repeating wave): it crosses the y-axis at (0, 5); it has a maximum point at (3, 8) and a minimum point at (9, 2).

Model answer

The line \(d = 6.5\) meets the curve at \(t = 1\) and \(t = 5\).
The depth is at least 6.5 m between these times.
The boat can enter the harbour between 01:00 and 05:00.
(Check: \(5 + 3\sin 30^\circ = 5 + 1.5 = 6.5\))

Explanation

Draw a horizontal line at a depth of 6.5 m and find where it meets the curve; the depth is above 6.5 m between those two times. Interpreting \(t\) as hours after midnight turns the values into clock times. The exact values come from \(\sin 30^\circ = \sin 150^\circ = 0.5\).

Mark scheme
  1. 1 mark

    M1 for using the line \(d = 6.5\)

    or for \(\sin(30t)^\circ = 0.5\); correct answer with no working scores full marks

  2. 1 mark

    A1 for \(t = 1\) and \(t = 5\)

  3. 1 mark

    C1 for between 01:00 and 05:00

    ft their values of t

Question 4

4 marks

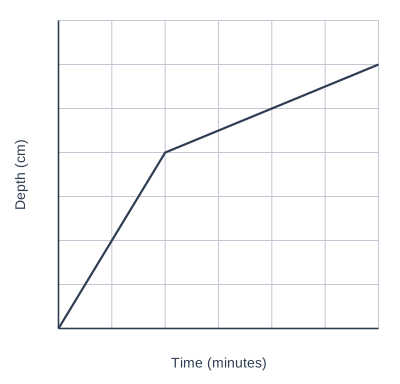
Water flows at a constant rate into a container made from two cylinders, one on top of the other.
The lower cylinder has radius 10 cm.
The graph shows the depth of water in the container as it fills.

Work out the radius of the upper cylinder.

A graph of Depth (cm) (vertical axis, 0 to 35, marked every 5) against Time (minutes) (horizontal axis, 0 to 15, marked every 2.5), on a grid. The graph is made of straight-line sections joining (0, 0), (5, 20) and (15, 30).

Model answer

Lower cylinder: depth rises 20 cm in 5 minutes = 4 cm per minute.
Upper cylinder: depth rises 10 cm in 10 minutes = 1 cm per minute.
Flow rate \(= \pi \times 10^2 \times 4 = 400\pi\) cm³ per minute.
Upper cylinder: \(\pi r^2 \times 1 = 400\pi\), so \(r^2 = 400\) and \(r = 20\) cm.

Explanation

The gradient of each section is the rate the depth rises. The volume of water added each minute is the same in both cylinders, so cross-sectional area × rate of rise is constant. The depth rises 4 times as slowly in the upper cylinder, so its area is 4 times as big, and its radius is \(\sqrt{4} = 2\) times as big.

Mark scheme
  1. 1 mark

    P1 for the rates of rise from the graph: 4 cm per minute and 1 cm per minute

    oe, e.g. 20 cm in 5 min and 10 cm in 10 min; correct answer with no working scores full marks

  2. 1 mark

    P1 for the rate of flow, \(\pi \times 10^2 \times 4 = 400\pi\) cm³ per minute

    or the idea that the area must be 4 times as big

  3. 1 mark

    P1 for \(\pi r^2 \times 1 = 400\pi\) or \(r^2 = 400\)

  4. 1 mark

    A1 for 20 cm

    cao

Ready to try the rest? Every answer you write is marked against the mark scheme, so you can see exactly where the marks are.

AI Tutor Hints first, answers after you try

Hi! Stuck? Ask me for a hint and I’ll help you work it out. Once you’ve checked your answer I can explain exactly where the marks are.