
Level:
Correct: 0
Incorrect: 0
Marks: 0/0
Exam Practice
Course:
Topics:
AQA GCSE Maths (Higher non-calculator) Smart practice A mixed round aimed at your weak spots
Unit 1
Number
Unit 2
Algebra
Unit 3
Ratio, proportion and rates of change
Unit 4
Geometry and measures
Unit 5
Probability
Unit 6
Statistics
Avg
score:
–
Topics
done:
0/97

Using statistics to describe a population

Practise 18 exam-style questions on Using statistics to describe a population for AQA GCSE Maths (Higher non-calculator). Write your answer as you would in the exam and get it marked in seconds against the mark scheme, point by point, with the Study Helper on hand if you get stuck.

  • 18 questions
  • 1–5 marks each
  • Instant marking
  • No sign-up needed
18 questions, marked as you go

Sample questions with model answers

Here are 4 of the questions in this topic, each with a model answer, an explanation of why it earns the marks and the mark scheme an examiner would use.

Question 1

2 marks

A farmer has 600 sheep.
He weighs a random sample of 20 of the sheep.
The mean mass of the sheep in the sample is 65 kg.

Work out an estimate for the total mass of all 600 sheep.

Model answer

Assume the mean mass of all the sheep is about the same as the sample mean, 65 kg.
Total mass \(\approx 600 \times 65 = 39\,000\) kg

Explanation

The sample mean is used as an estimate of the population mean. Since mean = total ÷ number, the total is approximately the mean × the number of sheep in the whole flock (600, not the 20 in the sample).

Mark scheme
  1. 1 mark

    M1 for \(600 \times 65\)

  2. 1 mark

    A1 for 39 000 kg

    correct answer with no working scores full marks
Question 2

2 marks

Ravi wants to find out what proportion of the people in his town like football.
He asks 20 people at a football match.
19 of them say they like football.

Ravi says,
"95% of the people in my town like football."

Give two reasons why Ravi's conclusion may not be correct.

Model answer

The sample is biased: people at a football match are much more likely to like football than other people, so they do not represent the whole town.
The sample is too small: 20 people is not enough to describe the whole town.

Explanation

To use a sample to describe a population, the sample must represent the population (random, not biased) and be large enough. Asking people where football fans gather gives a result that is far too high.

Mark scheme
  1. 1 mark

    B1 for the sample is biased, e.g. people at a football match are likely to like football, so they do not represent the town

    oe

  2. 1 mark

    B1 for the sample is too small (only 20 people)

    oe; accept 'the people at the match may not live in his town'

Question 3

3 marks

A company says that the mean mass of its bags of flour is at least 500 g.
A random sample of 8 bags has these masses, in grams.

498   502   495   501   499   497   503   493

Does this sample support the company's claim?
You must show your working.

Model answer

Total: \(498 + 502 + 495 + 501 + 499 + 497 + 503 + 493 = 3988\) g
Mean: \(3988 \div 8 = 498.5\) g
No. The mean of the sample is 498.5 g, which is less than 500 g, so the sample does not support the claim (although a sample of 8 bags is quite small).

Explanation

Work out the sample mean and compare it with the claim. A quick way is to find each bag's difference from 500 g: \(-2 + 2 - 5 + 1 - 1 - 3 + 3 - 7 = -12\), so the mean is \(500 - 1.5 = 498.5\) g.

Mark scheme
  1. 1 mark

    M1 for a total of 3988, or differences from 500 totalling −12

  2. 1 mark

    M1dep for their \(3988 \div 8\) or \(500 - 12 \div 8\)

  3. 1 mark

    A1 for No, with a mean of 498.5 g (less than 500 g)

    answer only scores 0

Question 4

4 marks

A company makes 4000 batteries.
It tests a random sample of 80 of the batteries.
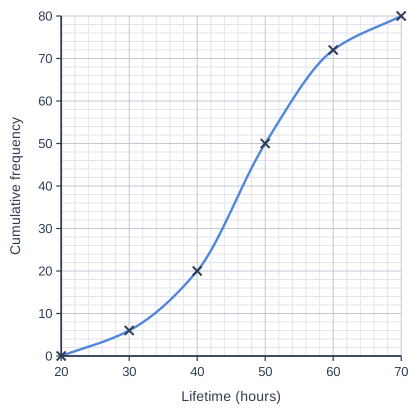
The cumulative frequency graph shows how long the batteries in the sample lasted.

The company replaces, free of charge, any battery that lasts less than 30 hours.
Each replacement costs the company £12
The company has set aside £4000 for replacements.

Is this likely to be enough?
You must show your working.

Cumulative frequency graph on a grid of small squares. The horizontal axis is "Lifetime (hours)", from 20 to 70, numbered every 10, with 5 small squares between numbered values (each small square is 2). The vertical axis is "Cumulative frequency", from 0 to 80, numbered every 10, with 5 small squares between numbered values (each small square is 2). A smooth curve starts at (20, 0) and passes through (30, 6), (40, 20), (50, 50), (60, 72) and (70, 80) (each point is marked with a cross).

Model answer

At 30 hours the cumulative frequency is 6, so 6 of the 80 batteries in the sample lasted less than 30 hours.
Estimate for all the batteries: \(\dfrac{6}{80} \times 4000 = 300\)
Cost: \(300 \times £12 = £3600\)
£3600 is less than £4000, so yes, it is likely to be enough.

Explanation

Read the number of batteries in the sample that lasted less than 30 hours, then scale up from 80 to 4000 (multiply by 50). This assumes the sample is representative of all the batteries, so the answer is only an estimate.

Mark scheme
  1. 1 mark

    M1 for reading 6 at 30 hours

  2. 1 mark

    M1 for \(\dfrac{\text{their } 6}{80} \times 4000\) or 300

    oe

  3. 1 mark

    M1dep for their \(300 \times 12\)

  4. 1 mark

    A1 for Yes, with £3600

    must have correct value; answer only scores 0

Ready to try the rest? Every answer you write is marked against the mark scheme, so you can see exactly where the marks are.

Study Helper Hints first, answers after you try

Stuck on this one? Ask for a hint and I’ll point you in the right direction, without giving the answer away. Once you’ve checked your answer, I’ll show you how the marks are awarded.