Level:
Correct: 0
Incorrect: 0
Marks: 0/0
Exam Practice
Course:
Topics:
AQA GCSE Maths (Higher non-calculator) Smart practice A mixed round aimed at your weak spots
Unit 1
Number
Unit 2
Algebra
Unit 3
Ratio, proportion and rates of change
Unit 4
Geometry and measures
Unit 5
Probability
Unit 6
Statistics
Avg
score:
–
Topics
done:
0/97

Real-life and non-standard graphs

Practise 29 exam-style questions on Real-life and non-standard graphs for AQA GCSE Maths (Higher non-calculator). Write your answer as you would in the exam and get it marked in seconds against the mark scheme, point by point, with the Study Helper on hand if you get stuck.

  • 29 questions
  • 1–5 marks each
  • Instant marking
  • No sign-up needed
20 questions, marked as you go

Sample questions with model answers

Here are 4 of the questions in this topic, each with a model answer, an explanation of why it earns the marks and the mark scheme an examiner would use.

Question 1

1 mark

The graph shows the cost of taxi journeys with one company, for distances up to 10 miles.

The line crosses the vertical axis at 3
What does this value represent?
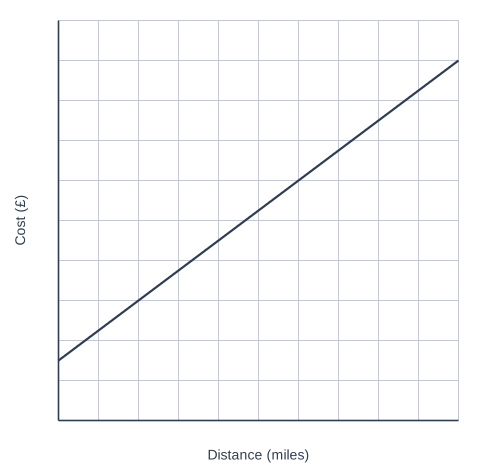
A graph of Cost (£) (vertical axis, 0 to 20, marked every 2) against Distance (miles) (horizontal axis, 0 to 10, marked every 1), on a grid. The graph is a straight line joining (0, 3) and (10, 18).

Model answer

It is the cost when the distance is 0 miles: a fixed charge of £3 that every journey pays before the cost per mile is added.

Explanation

The vertical intercept is the value of the cost when the distance is zero, so it is a fixed charge paid on every journey. The cost per mile is shown by the gradient of the line, not by the intercept.

Mark scheme
  1. 1 mark

    B1 for a fixed charge of £3 that is paid before any distance is travelled

    oe, e.g. "the cost of a journey of 0 miles", "the starting charge", "the cost of just getting into the taxi"; do not accept "£3 per mile" or "the start of the journey" on its own
Question 2

2 marks

A group of workers is building a wall.
All the workers work at the same rate.
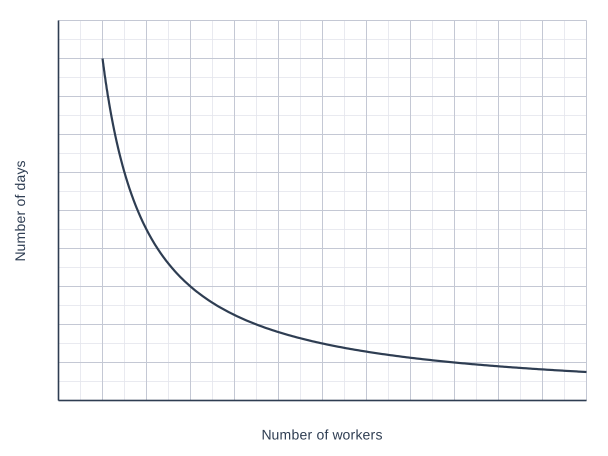
The graph shows the number of days it takes to build the wall for different numbers of workers.

Jo says,
"If the number of workers is doubled, the number of days it takes is halved."

Is Jo correct?
Use readings from the graph to support your answer.

A graph of Number of days (vertical axis, 0 to 40, marked every 4) against Number of workers (horizontal axis, 0 to 12, marked every 1), on a grid with 2 small squares to each large square. The curve is a curve; its key points can be read from the grid.

Model answer

3 workers take 12 days and 6 workers take 6 days.
2 workers take 18 days and 4 workers take 9 days.
Each time the number of workers doubles, the number of days halves.
Yes, Jo is correct.

Explanation

The graph is a reciprocal curve: number of days = \(\dfrac{36}{\text{number of workers}}\), so the number of days is inversely proportional to the number of workers. Check Jo's claim with at least two pairs of readings where the number of workers doubles.

Mark scheme
  1. 1 mark

    M1 for two pairs of readings where the number of workers doubles, e.g. 3 workers take 12 days and 6 workers take 6 days

    or 2 workers 18 days and 4 workers 9 days, or 6 workers 6 days and 12 workers 3 days

  2. 1 mark

    A1 for Yes, with correct readings showing the number of days halves

    accept "Yes, workers × days = 36 each time" with at least two correct readings

Question 3

3 marks

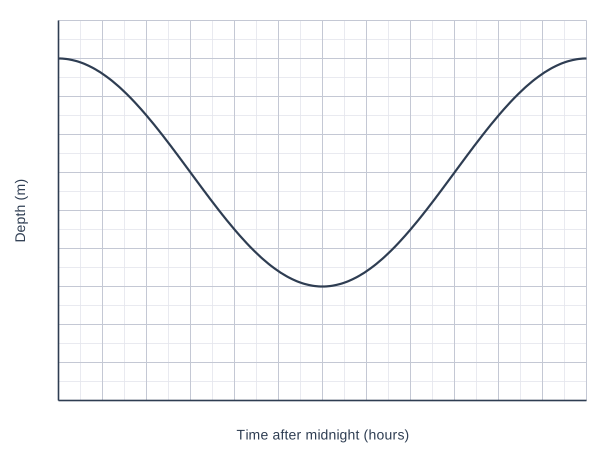
The graph shows the depth of water in a harbour between midnight and noon one day.

A boat can only enter the harbour when the depth of the water is at least 7.5 m.

For how many hours between midnight and noon can the boat enter the harbour?

A graph of Depth (m) (vertical axis, 0 to 10, marked every 1) against Time after midnight (hours) (horizontal axis, 0 to 12, marked every 1), on a grid with 2 small squares to each large square. The curve is a cosine curve (a smooth repeating wave); its key points can be read from the grid.

Model answer

Go across from 7.5 m: the curve is at 7.5 m at 2 hours and at 10 hours after midnight.
The depth is at least 7.5 m from 0 to 2 hours and from 10 to 12 hours.
Total = 2 + 2 = 4 hours

Explanation

A horizontal line at 7.5 m meets the curve twice. The depth is at least 7.5 m where the curve is on or above that line, which happens at the start and at the end of the morning, so add the two time periods. The 8 hours in the middle is when the boat cannot enter.

Mark scheme
  1. 1 mark

    M1 for a reading of a time when the depth is 7.5 m: 2 hours or 10 hours after midnight

    accept [1.8, 2.2] or [9.8, 10.2]

  2. 1 mark

    A1 for both times: from midnight to 2 am and from 10 am to noon

  3. 1 mark

    A1 for 4 hours

    accept [3.6, 4.4]; correct answer with no working scores full marks

Question 4

4 marks

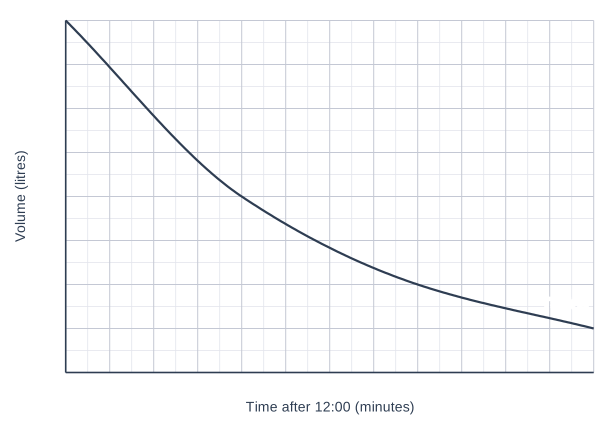
At 12:00 a tap is opened and water drains out of tank A.
The graph shows the volume of water in tank A after 12:00.

At 12:00 tank B is empty.
Water is pumped into tank B at a constant rate of 50 litres per minute.

At what time do the two tanks contain the same volume of water?
How much water is in each tank at this time?

A graph of Volume (litres) (vertical axis, 0 to 400, marked every 50) against Time after 12:00 (minutes) (horizontal axis, 0 to 12, marked every 1), on a grid with 2 small squares to each large square. The curve labelled "Tank A" is a smooth curve; its values can be read from the grid.

Model answer

Tank B: volume = 50 × number of minutes, so its volume increases from 0 while tank A's decreases from 400 litres.
After 4 minutes: B = 50 × 4 = 200 litres, A = 200 litres (from the graph).
The tanks contain the same volume at 12:04, with 200 litres in each.

Explanation

Tank B would be a straight line on the same graph, from (0, 0) rising 50 litres every minute. The tanks hold the same volume where this line meets the curve for tank A. Checking the volume of tank B at whole minutes against the graph finds the crossing point.

Mark scheme
  1. 1 mark

    M1 for the volume in tank B at a time, e.g. after 4 minutes it holds 50 × 4 = 200 litres

    or a line for tank B from (0, 0) through (4, 200) described

  2. 1 mark

    M1 for comparing the volumes in both tanks at the same time, e.g. both hold 200 litres after 4 minutes

    or the line for tank B meeting the curve for tank A

  3. 1 mark

    A1 for 12:04

    accept "4 minutes after 12:00"; from a graphical method accept a time in [3.8, 4.2] minutes after 12:00

  4. 1 mark

    A1 for 200 litres

    accept [190, 210] from a graphical method; correct answers with no working score full marks

Ready to try the rest? Every answer you write is marked against the mark scheme, so you can see exactly where the marks are.

Study Helper Hints first, answers after you try

Stuck on this one? Ask for a hint and I’ll point you in the right direction, without giving the answer away. Once you’ve checked your answer, I’ll show you how the marks are awarded.