Level:
Correct: 0
Incorrect: 0
Marks: 0/0
Exam Practice
Course:
Topics:
AQA GCSE Maths (Higher non-calculator) Smart practice A mixed round aimed at your weak spots
Unit 1
Number
Unit 2
Algebra
Unit 3
Ratio, proportion and rates of change
Unit 4
Geometry and measures
Unit 5
Probability
Unit 6
Statistics
Avg
score:
–
Topics
done:
0/97

Frequency trees and probability experiments

Practise 28 exam-style questions on Frequency trees and probability experiments for AQA GCSE Maths (Higher non-calculator). Write your answer as you would in the exam and get it marked in seconds against the mark scheme, point by point, with the Study Helper on hand if you get stuck.

  • 28 questions
  • 1–5 marks each
  • Instant marking
  • No sign-up needed
20 questions, marked as you go

Sample questions with model answers

Here are 4 of the questions in this topic, each with a model answer, an explanation of why it earns the marks and the mark scheme an examiner would use.

Question 1

1 mark

Kim asks 60 students whether they walk to school.
She records the results in a frequency tree.
Here are the numbers Kim writes in her frequency tree.

Boys 34, girls 26
Boys who walk 19, boys who do not walk 13
Girls who walk 11, girls who do not walk 15

Kim's frequency tree must be wrong.
Give a reason why.

Model answer

\(19 + 13 = 32\), but there are 34 boys, so the numbers on the boys' branches do not add up to the number of boys.

Explanation

In a frequency tree the numbers at the ends of a set of branches must add up to the number they split from. Check each split: \(34 + 26 = 60\) and \(11 + 15 = 26\) are correct, but \(19 + 13 = 32\), not 34.

Mark scheme
  1. 1 mark

    B1 for a correct reason, e.g. \(19 + 13 = 32\), but there are 34 boys

    oe, e.g. the boys who walk and the boys who do not walk should add up to 34; do not accept a reason about the girls or the total, as \(34 + 26 = 60\) and \(11 + 15 = 26\) are correct
Question 2

2 marks

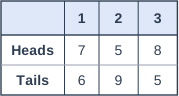
Ella spins a three-sided spinner numbered 1, 2 and 3 and flips a coin.
She does this 40 times.
The table shows her results.

Use Ella's results to estimate the probability of getting tails and an odd number.
Give your answer as a percentage.

Table with columns (row headings), "1", "2", "3". Heads; 1: 7; 2: 5; 3: 8 | Tails; 1: 6; 2: 9; 3: 5.

Model answer

Tails and 1: 6
Tails and 3: 5
\(6 + 5 = 11\)
\(\dfrac{11}{40} = \dfrac{27.5}{100} = 27.5\%\)

Explanation

The odd numbers on the spinner are 1 and 3, so add the frequencies for tails with 1 and tails with 3. Divide by the 40 trials and convert to a percentage: \(\dfrac{11}{40} = \dfrac{27.5}{100}\). A common mistake is to forget that 1 is an odd number.

Mark scheme
  1. 1 mark

    M1 for \(6 + 5\) or 11 seen, or \(\dfrac{11}{40}\)

    oe

  2. 1 mark

    A1 for 27.5%

    correct answer with no working scores full marks; \(\dfrac{11}{40}\) or 0.275 without a percentage scores M1 A0

Question 3

3 marks

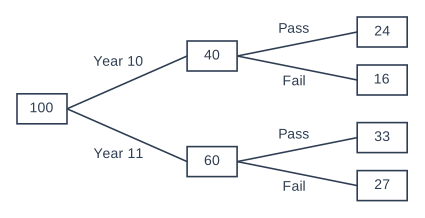
The frequency tree shows information about 100 students who took a first aid test.

Ravi says,
"A Year 11 student is more likely to pass than a Year 10 student, because more Year 11 students passed."

Is Ravi correct?
You must show your working.

A frequency tree drawn from left to right with 2 stages of branches. It starts from a box containing 100 on the left. From the first box, branches labelled "Year 10" and "Year 11" lead to a box containing 40 and a box containing 60 respectively. From the "Year 10" box, branches labelled "Pass" and "Fail" lead to a box containing 24 and a box containing 16 respectively. From the "Year 11" box, branches labelled "Pass" and "Fail" lead to a box containing 33 and a box containing 27 respectively.

Model answer

Year 10: \(\dfrac{24}{40} = 0.6\)
Year 11: \(\dfrac{33}{60} = 0.55\)
\(0.6 > 0.55\)
No, Ravi is not correct. A Year 10 student is more likely to pass.

Explanation

There are more Year 11 students, so comparing the numbers who passed is not fair. Compare the proportion of each year group who passed instead: \(\dfrac{24}{40} = 0.6\) and \(\dfrac{33}{60} = 0.55\).

Mark scheme
  1. 1 mark

    M1 for \(\dfrac{24}{40}\) or \(\dfrac{33}{60}\)

    oe

  2. 1 mark

    M1 for both in a form that can be compared, e.g. 0.6 and 0.55, 60% and 55%, or \(\dfrac{72}{120}\) and \(\dfrac{66}{120}\)

  3. 1 mark

    A1 for No with correct values for both

    e.g. No, a Year 10 student is more likely to pass (0.6 > 0.55); answer only scores 0

Question 4

4 marks

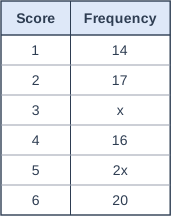
Zara rolls a dice 100 times.
The table shows information about her results.

Use Zara's results to estimate the probability that the dice shows a number greater than 4

Table with columns "Score", "Frequency". Score: 1; Frequency: 14 | Score: 2; Frequency: 17 | Score: 3; Frequency: x | Score: 4; Frequency: 16 | Score: 5; Frequency: 2x | Score: 6; Frequency: 20.

Model answer

\(14 + 17 + x + 16 + 2x + 20 = 100\)
\(3x + 67 = 100\)
\(3x = 33\)
\(x = 11\)
Frequency of 5 \(= 2 \times 11 = 22\)
Greater than 4 means 5 or 6: \(22 + 20 = 42\)
Probability \(= \dfrac{42}{100} = 0.42\)

Explanation

The frequencies add up to the number of rolls, 100, which gives an equation in \(x\). "Greater than 4" means 5 or 6 only (not 4), so add those two frequencies and divide by 100. A common mistake is to use \(x = 11\) as the frequency of 5 instead of \(2x = 22\).

Mark scheme
  1. 1 mark

    M1 for \(14 + 17 + x + 16 + 2x + 20 = 100\)

    oe, e.g. \(3x + 67 = 100\) or \(3x = 33\)

  2. 1 mark

    A1 for \(x = 11\)

  3. 1 mark

    M1 for \(2 \times\) their 11 \(+ 20\) or 42

    frequencies of 5 and 6

  4. 1 mark

    A1 for \(\dfrac{42}{100}\)

    oe, e.g. \(\dfrac{21}{50}\), 0.42 or 42%; correct answer with no working scores full marks

Ready to try the rest? Every answer you write is marked against the mark scheme, so you can see exactly where the marks are.

Study Helper Hints first, answers after you try

Stuck on this one? Ask for a hint and I’ll point you in the right direction, without giving the answer away. Once you’ve checked your answer, I’ll show you how the marks are awarded.