Level:
Correct: 0
Incorrect: 0
Marks: 0/0
Exam Practice
Course:
Topics:
AQA GCSE Maths (Higher non-calculator) Smart practice A mixed round aimed at your weak spots
Unit 1
Number
Unit 2
Algebra
Unit 3
Ratio, proportion and rates of change
Unit 4
Geometry and measures
Unit 5
Probability
Unit 6
Statistics
Avg
score:
–
Topics
done:
0/97

Charts, tables and diagrams

Practise 28 exam-style questions on Charts, tables and diagrams for AQA GCSE Maths (Higher non-calculator). Write your answer as you would in the exam and get it marked in seconds against the mark scheme, point by point, with the Study Helper on hand if you get stuck.

  • 28 questions
  • 1–5 marks each
  • Instant marking
  • No sign-up needed
20 questions, marked as you go

Sample questions with model answers

Here are 4 of the questions in this topic, each with a model answer, an explanation of why it earns the marks and the mark scheme an examiner would use.

Question 1

2 marks

The table shows how 40 students travel to school.

Lena is going to show this information on a pie chart.
Work out the size of the angle for Walk.
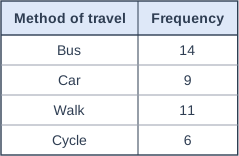
Table with columns "Method of travel", "Frequency". Method of travel: Bus; Frequency: 14 | Method of travel: Car; Frequency: 9 | Method of travel: Walk; Frequency: 11 | Method of travel: Cycle; Frequency: 6.

Model answer

\(14 + 9 + 11 + 6 = 40\) students
\(360 \div 40 = 9^\circ\) for each student
Walk: \(11 \times 9 = 99^\circ\)

Explanation

The whole circle, 360°, represents all 40 students, so each student is \(360 \div 40 = 9^\circ\). Multiply the frequency for Walk by 9. A common mistake is to use 11 out of 100 (a percentage) instead of 11 out of 40.

Mark scheme
  1. 1 mark

    M1 for \(360 \div 40\) or 9 (degrees for each student) or \(\dfrac{11}{40} \times 360\)

    oe

  2. 1 mark

    A1 for 99°

    correct answer with no working scores full marks
Question 2

2 marks

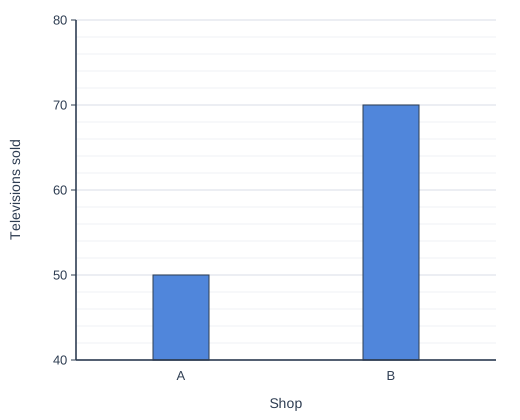
The bar chart shows the number of televisions sold by two shops, A and B, in one month.

Tom says,
"The bar chart shows that shop B sold three times as many televisions as shop A."

Is Tom correct?
Give a reason for your answer.

Bar chart of televisions sold for each shop: A 50, B 70. The vertical axis starts at 40, not 0.

Model answer

No. Shop A sold 50 televisions and shop B sold 70. Three times 50 is 150, so B did not sell three times as many.
The vertical axis starts at 40, not 0, so the bar for B looks three times as tall as the bar for A (30 above 40 compared with 10 above 40).

Explanation

Always check where the scale on a chart starts. When the axis does not start at zero, the heights of the bars are not in proportion to the values, which makes differences look bigger than they are.

Mark scheme
  1. 1 mark

    B1 for No, with values: shop A sold 50 and shop B sold 70 (and \(3 \times 50 = 150\))

    accept 'B sold 20 more than A' or 'B sold 1.4 times as many' with No

  2. 1 mark

    B1 for the vertical axis does not start at 0 (it starts at 40), so the bar for B only looks three times as tall

    oe

Question 3

3 marks

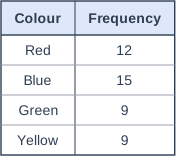
The table shows the favourite colours of 45 people.

Ben is making a pie chart of this data.
Here is his working for the angles.

Red: 12 × 10 = 120°
Blue: 15 × 10 = 150°
Green: 9 × 10 = 90°
Yellow: 9 × 10 = 90°

What mistake has Ben made?
Work out the correct angle for Blue.

Table with columns "Colour", "Frequency". Colour: Red; Frequency: 12 | Colour: Blue; Frequency: 15 | Colour: Green; Frequency: 9 | Colour: Yellow; Frequency: 9.

Model answer

Ben has used 10° for each person. There are 45 people, so his angles add up to 450°, not 360°.
Each person should be \(360 \div 45 = 8^\circ\).
Blue: \(15 \times 8 = 120^\circ\)

Explanation

The angles in a pie chart must add up to 360°, so the angle for each person is 360 divided by the total frequency. Always check that your angles add up to 360° before drawing. Ben's 10° per person would only work for a total of 36 people.

Mark scheme
  1. 1 mark

    B1 for a correct mistake, e.g. he has used 10° for each person, but it should be \(360 \div 45 = 8^\circ\)

    accept 'his angles add up to 450° not 360°' oe

  2. 1 mark

    M1 for \(360 \div 45\) or 8 or \(\dfrac{15}{45} \times 360\)

    oe

  3. 1 mark

    A1 for 120°

    correct angle with no working scores the M1 and A1

Question 4

4 marks

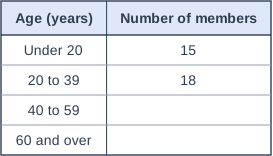
The table shows the ages of the members of a sports club.
Two of the numbers are missing.

On a pie chart of the ages, the angle for 20 to 39 is 120°.
The ratio of members aged 40 to 59 to members aged 60 and over is 4 : 3

Work out the number of members aged 60 and over.

Table with columns "Age (years)", "Number of members". Age (years): Under 20; Number of members: 15 | Age (years): 20 to 39; Number of members: 18 | Age (years): 40 to 59; Number of members: (blank) | Age (years): 60 and over; Number of members: (blank).

Model answer

120° is \(\dfrac{120}{360} = \dfrac{1}{3}\) of the circle, so 18 is \(\dfrac{1}{3}\) of the members.
Total: \(18 \times 3 = 54\)
40 to 59 and 60 and over: \(54 - 15 - 18 = 21\)
\(21 \div (4 + 3) = 3\)
60 and over: \(3 \times 3 = 9\)

Explanation

The angle tells you what fraction of all the members are aged 20 to 39, which gives the total. Subtract the known groups, then share the rest in the ratio 4 : 3 (7 parts). Check: 15 + 18 + 12 + 9 = 54.

Mark scheme
  1. 1 mark

    M1 for the total number of members, \(18 \times \dfrac{360}{120}\) or 54

    oe, e.g. 120° is \(\frac{1}{3}\) of the circle so \(18 \times 3\)

  2. 1 mark

    M1dep for \(\text{their } 54 - 15 - 18\) or 21

  3. 1 mark

    M1 for \(\text{their } 21 \div 7 \times 3\)

    oe; 12 and 9 seen implies M1

  4. 1 mark

    A1 for 9

    correct answer with no working scores full marks
Ready to try the rest? Every answer you write is marked against the mark scheme, so you can see exactly where the marks are.

Study Helper Hints first, answers after you try

Stuck on this one? Ask for a hint and I’ll point you in the right direction, without giving the answer away. Once you’ve checked your answer, I’ll show you how the marks are awarded.