Level:
Correct: 0
Incorrect: 0
Marks: 0/0
Exam Practice
Course:
Topics:
AQA GCSE Maths (Higher non-calculator) Smart practice A mixed round aimed at your weak spots
Unit 1
Number
Unit 2
Algebra
Unit 3
Ratio, proportion and rates of change
Unit 4
Geometry and measures
Unit 5
Probability
Unit 6
Statistics
Avg
score:
–
Topics
done:
0/97

Histograms and cumulative frequency

Practise 36 exam-style questions on Histograms and cumulative frequency for AQA GCSE Maths (Higher non-calculator). Write your answer as you would in the exam and get it marked in seconds against the mark scheme, point by point, with the Study Helper on hand if you get stuck.

  • 36 questions
  • 1–5 marks each
  • Instant marking
  • No sign-up needed
20 questions, marked as you go

Sample questions with model answers

Here are 4 of the questions in this topic, each with a model answer, an explanation of why it earns the marks and the mark scheme an examiner would use.

Question 1

1 mark

A cumulative frequency graph shows the times of 80 people.
The cumulative frequency axis goes from 0 to 100.

Leah estimates the median by reading across from 50 on the cumulative frequency axis, because 50 is halfway up the axis.

What mistake has Leah made?

Model answer

The median is the middle of the 80 people, so Leah should read across from \(80 \div 2 = 40\), not from 50. The top of the axis is not the total frequency.

Explanation

Always use the total frequency (the height of the end of the curve), not the scale on the axis. For the median read across from \(\frac{1}{2}\) of the total, and for the quartiles from \(\frac{1}{4}\) and \(\frac{3}{4}\) of the total.

Mark scheme
  1. 1 mark

    B1 for she should read across from half of the total frequency, 40 (not half of the axis)

    oe; must mention 40 or half of 80
Question 2

2 marks

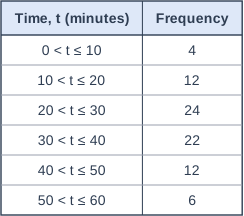
The table shows information about the time, t minutes, that 80 customers waited to be served.

Amy drew a cumulative frequency graph for this data.
She plotted the points (5, 4), (15, 16), (25, 40), (35, 62), (45, 74) and (55, 80).

What mistake has Amy made?
Write down the point she should have plotted instead of (25, 40).

Table with columns "Time, t (minutes)", "Frequency". Time, t (minutes): 0 < t ≤ 10; Frequency: 4 | Time, t (minutes): 10 < t ≤ 20; Frequency: 12 | Time, t (minutes): 20 < t ≤ 30; Frequency: 24 | Time, t (minutes): 30 < t ≤ 40; Frequency: 22 | Time, t (minutes): 40 < t ≤ 50; Frequency: 12 | Time, t (minutes): 50 < t ≤ 60; Frequency: 6.

Model answer

Amy has plotted each cumulative frequency at the midpoint of its class. Cumulative frequencies should be plotted at the upper class boundaries (10, 20, 30, ...).
Instead of (25, 40) she should plot (30, 40).

Explanation

A cumulative frequency of 40 means 40 customers waited up to the end of the class \(20 < t \le 30\), so it belongs at t = 30. Midpoints are used for frequency polygons and for estimating the mean, not for cumulative frequency graphs.

Mark scheme
  1. 1 mark

    B1 for she has plotted the cumulative frequencies at the midpoints of the classes instead of at the upper class boundaries

    oe

  2. 1 mark

    B1 for (30, 40)

Question 3

3 marks

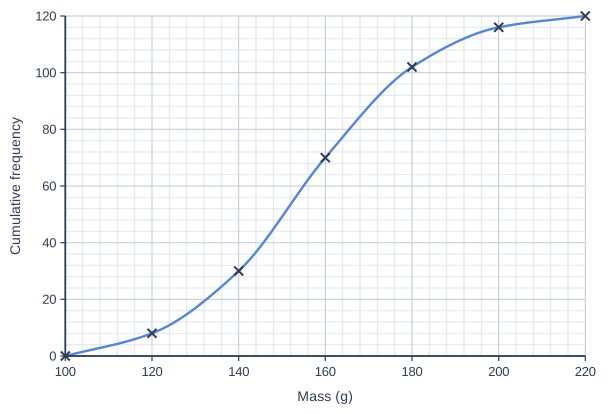
The cumulative frequency graph shows information about the masses, m grams, of 120 potatoes.

Use the graph to estimate the interquartile range of the masses.

Cumulative frequency graph on a grid of small squares. The horizontal axis is "Mass (g)", from 100 to 220, numbered every 20, with 5 small squares between numbered values (each small square is 4). The vertical axis is "Cumulative frequency", from 0 to 120, numbered every 20, with 5 small squares between numbered values (each small square is 4). A smooth curve starts at (100, 0) and passes through (120, 8), (140, 30), (160, 70), (180, 102), (200, 116) and (220, 120) (each point is marked with a cross).

Model answer

Lower quartile: read across from \(\frac{1}{4} \times 120 = 30\), giving 140 g
Upper quartile: read across from \(\frac{3}{4} \times 120 = 90\), giving about 171 g
Interquartile range \(\approx 171 - 140 = 31\) g

Explanation

The quartiles are a quarter and three quarters of the way through the data, so read across from 30 and 90 (not from 25 and 75). The interquartile range is the upper quartile minus the lower quartile, and measures the spread of the middle half of the data.

Mark scheme
  1. 1 mark

    M1 for reading across from 30 or from 90, or for the lower quartile in [138, 142] or the upper quartile in [168, 175]

  2. 1 mark

    M1 for their upper quartile − their lower quartile, with both read from 90 and 30

  3. 1 mark

    A1 for an answer in [28, 35] g

    correct answer with no working scores full marks

Question 4

4 marks

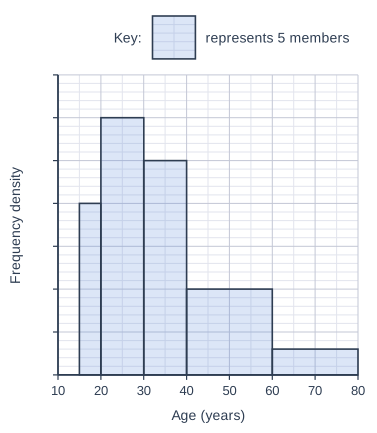
The histogram shows information about the ages of the members of a gym.
The frequency density axis has no scale, but a key is given.

Work out an estimate for the number of members aged between 25 and 50.

Histogram drawn on a grid of small squares. The horizontal axis is "Age (years)", from 10 to 80, numbered every 10, with 2 small squares between numbered values (each small square is 5). The vertical axis is "Frequency density"; it has tick marks every 5 small squares but no numbers. The bars touch, with no gaps between them. Bars: from 15 to 20 (1 small squares wide), 20 small squares tall; from 20 to 30 (2 small squares wide), 30 small squares tall; from 30 to 40 (2 small squares wide), 25 small squares tall; from 40 to 60 (4 small squares wide), 10 small squares tall; from 60 to 80 (4 small squares wide), 3 small squares tall. Key: a shaded rectangle 2 small squares wide and 5 small squares tall represents 5 members.

Model answer

Each small square is 5 years across and 0.1 up, and the key shows 10 small squares represent 5 members, so 2 small squares represent 1 member.
25 to 30: 1 square wide × 30 squares tall = 30 squares = 15 members
30 to 40: 2 squares wide × 25 squares tall = 50 squares = 25 members
40 to 50: 2 squares wide × 10 squares tall = 20 squares = 10 members
Estimate: \(15 + 25 + 10 = 50\) members

Explanation

The area of each bar represents its frequency, and the key tells you how much area stands for 5 members. For the classes 20 to 30 and 40 to 60 you only need part of the bar, so take the area of that part, assuming the ages are spread evenly within each class.

Mark scheme
  1. 1 mark

    M1 for a correct use of the key, e.g. 1 small square represents 0.5 members (2 small squares represent 1 member), or the frequency density of a class, e.g. 3 for 20 to 30

    oe, e.g. one correct class frequency: 10, 30, 25, 20 or 6

  2. 1 mark

    M1 for one correct part-class frequency: 15 (25 to 30) or 10 (40 to 50)

    oe, e.g. half of 30 or half of 20

  3. 1 mark

    M1 for their 15 + 25 + their 10

    25 is the frequency of 30 to 40

  4. 1 mark

    A1 for 50

    correct answer with no working scores full marks

Ready to try the rest? Every answer you write is marked against the mark scheme, so you can see exactly where the marks are.

Study Helper Hints first, answers after you try

Stuck on this one? Ask for a hint and I’ll point you in the right direction, without giving the answer away. Once you’ve checked your answer, I’ll show you how the marks are awarded.