Level:
Correct: 0
Incorrect: 0
Marks: 0/0
Exam Practice
Course:
Topics:
AQA GCSE Maths (Higher non-calculator) Smart practice A mixed round aimed at your weak spots
Unit 1
Number
Unit 2
Algebra
Unit 3
Ratio, proportion and rates of change
Unit 4
Geometry and measures
Unit 5
Probability
Unit 6
Statistics
Avg
score:
–
Topics
done:
0/97

Scatter graphs and correlation

Practise 28 exam-style questions on Scatter graphs and correlation for AQA GCSE Maths (Higher non-calculator). Write your answer as you would in the exam and get it marked in seconds against the mark scheme, point by point, with the Study Helper on hand if you get stuck.

  • 28 questions
  • 1–5 marks each
  • Instant marking
  • No sign-up needed
20 questions, marked as you go

Sample questions with model answers

Here are 4 of the questions in this topic, each with a model answer, an explanation of why it earns the marks and the mark scheme an examiner would use.

Question 1

1 mark

The scatter graph shows the distance from home to school and the test score of each of 14 students.

Describe the correlation shown.
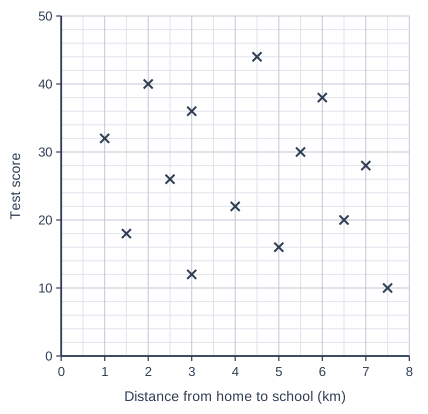
Scatter graph on a grid of small squares. The horizontal axis is "Distance from home to school (km)", from 0 to 8, numbered every 1, with 2 small squares between numbered values (each small square is 0.5). The vertical axis is "Test score", from 0 to 50, numbered every 10, with 5 small squares between numbered values (each small square is 2). 14 points are plotted as crosses: (1, 32), (1.5, 18), (2, 40), (2.5, 26), (3, 12), (3, 36), (4, 22), (4.5, 44), (5, 16), (5.5, 30), (6, 38), (6.5, 20), (7, 28) and (7.5, 10).

Model answer

There is no correlation: the points are scattered with no pattern, so there is no relationship between the distance from home to school and the test score.

Explanation

When the points show no upward or downward trend, there is no correlation. Here students who live far away scored both high and low marks, just like those who live close to school.

Mark scheme
  1. 1 mark

    B1 for no correlation

    accept 'no relationship between distance and test score'; do not accept 'negative' or 'weak negative'
Question 2

2 marks

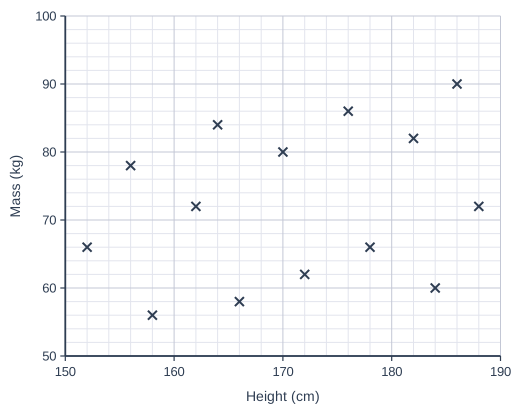
The scatter graph shows the heights and masses of 14 adults.

Ahmed says,
"The scatter graph shows strong positive correlation."

Is Ahmed correct?
Give a reason for your answer.

Scatter graph on a grid of small squares. The horizontal axis is "Height (cm)", from 150 to 190, numbered every 10, with 5 small squares between numbered values (each small square is 2). The vertical axis is "Mass (kg)", from 50 to 100, numbered every 10, with 5 small squares between numbered values (each small square is 2). 14 points are plotted as crosses: (152, 66), (156, 78), (158, 56), (162, 72), (164, 84), (166, 58), (170, 80), (172, 62), (176, 86), (178, 66), (182, 82), (184, 60), (186, 90) and (188, 72).

Model answer

No. There is a slight upward trend, so the correlation is positive, but the points are widely spread out and not close to a straight line, so it is weak positive correlation, not strong.

Explanation

The strength of correlation describes how close the points are to a straight line. Strong correlation: the points lie close to a line. Weak correlation: there is a trend, but the points are widely scattered about it, as here, where some of the tallest adults have below-average masses.

Mark scheme
  1. 1 mark

    B1 for No, it is weak positive correlation

    accept 'No, the correlation is weak'

  2. 1 mark

    B1dep for a correct reason, e.g. the points are widely spread out and not close to a straight line

    oe, e.g. 'some tall people have a low mass'

Question 3

3 marks

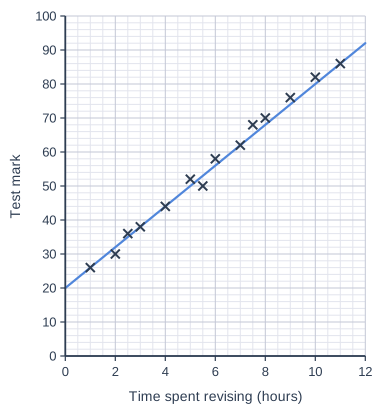
The scatter graph shows the time spent revising and the test mark of each of 14 students.
A line of best fit has been drawn.
The test was marked out of 100

Tom uses the line of best fit to estimate the mark of a student who revised for 6 hours.
Priya uses it to estimate the mark of a student who revised for 20 hours.

Whose estimate is likely to be more reliable?
Give two reasons for your answer.

Scatter graph on a grid of small squares. The horizontal axis is "Time spent revising (hours)", from 0 to 12, numbered every 2, with 4 small squares between numbered values (each small square is 0.5). The vertical axis is "Test mark", from 0 to 100, numbered every 10, with 5 small squares between numbered values (each small square is 2). 14 points are plotted as crosses: (1, 26), (2, 30), (2.5, 36), (3, 38), (4, 44), (5, 52), (5.5, 50), (6, 58), (7, 62), (7.5, 68), (8, 70), (9, 76), (10, 82) and (11, 86). A straight line of best fit is drawn; it passes through (0, 20) and (12, 92).

Model answer

Tom's estimate is more reliable.
6 hours is within the range of the data (1 to 11 hours), so Tom is interpolating. 20 hours is well outside the data, so Priya is extrapolating, and we do not know that the trend continues.
In fact it cannot continue: the line rises by about 6 marks per hour, so at 20 hours it would give about \(20 + 6 \times 20 = 140\) marks, but the test is only out of 100.

Explanation

Estimates from a line of best fit are most reliable within the range of the data. Beyond the data, the trend may change; here it must, because marks have a maximum of 100.

Mark scheme
  1. 1 mark

    B1 for Tom

  2. 1 mark

    B1 for 6 hours is within the range of the data (interpolation) but 20 hours is outside it (extrapolation)

    oe

  3. 1 mark

    B1 for continuing the line to 20 hours gives about 140 marks, which is impossible because the test is out of 100

    oe, e.g. 'the trend cannot continue because marks cannot go above 100'

Question 4

4 marks

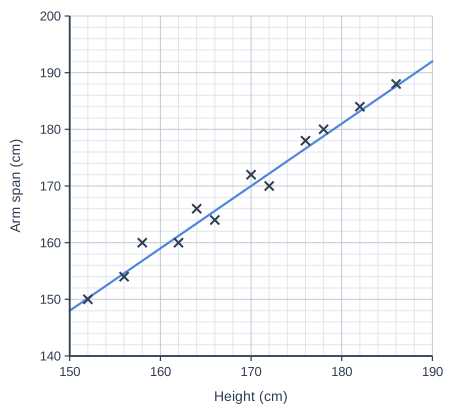
The scatter graph shows the heights, x cm, and arm spans, y cm, of 12 people.
The line of best fit passes through the points (150, 148) and (190, 192).

Work out the equation of the line of best fit.
Give your answer in the form \(y = mx + c\)

Scatter graph on a grid of small squares. The horizontal axis is "Height (cm)", from 150 to 190, numbered every 10, with 5 small squares between numbered values (each small square is 2). The vertical axis is "Arm span (cm)", from 140 to 200, numbered every 10, with 5 small squares between numbered values (each small square is 2). 12 points are plotted as crosses: (152, 150), (156, 154), (158, 160), (162, 160), (164, 166), (166, 164), (170, 172), (172, 170), (176, 178), (178, 180), (182, 184) and (186, 188). A straight line of best fit is drawn; it passes through (150, 148) and (190, 192).

Model answer

Gradient \(= \dfrac{192 - 148}{190 - 150} = \dfrac{44}{40} = 1.1\)
\(148 = 1.1 \times 150 + c\)
\(148 = 165 + c\)
\(c = -17\)
\(y = 1.1x - 17\)

Explanation

Find the gradient from the two points (change in y ÷ change in x), then substitute one point to find c. The axes do not start at 0, so you cannot read c from the graph: it is the value of y when x = 0, far outside the data. Check with the other point: \(1.1 \times 190 - 17 = 192\).

Mark scheme
  1. 1 mark

    M1 for \(\dfrac{192 - 148}{190 - 150}\)

    oe

  2. 1 mark

    A1 for gradient 1.1

  3. 1 mark

    M1 for substituting a point into \(y = \text{their } 1.1x + c\), e.g. \(148 = 1.1 \times 150 + c\)

    oe

  4. 1 mark

    A1 for \(y = 1.1x - 17\)

    oe, e.g. \(y = \frac{11}{10}x - 17\)

Ready to try the rest? Every answer you write is marked against the mark scheme, so you can see exactly where the marks are.

Study Helper Hints first, answers after you try

Stuck on this one? Ask for a hint and I’ll point you in the right direction, without giving the answer away. Once you’ve checked your answer, I’ll show you how the marks are awarded.