
Level:
Correct: 0
Incorrect: 0
Marks: 0/0
Exam Practice
Course:
Topics:
AQA GCSE Maths (Higher non-calculator) Smart practice A mixed round aimed at your weak spots
Unit 1
Number
Unit 2
Algebra
Unit 3
Ratio, proportion and rates of change
Unit 4
Geometry and measures
Unit 5
Probability
Unit 6
Statistics
Avg
score:
–
Topics
done:
0/97

Averages, spread and box plots

Practise 36 exam-style questions on Averages, spread and box plots for AQA GCSE Maths (Higher non-calculator). Write your answer as you would in the exam and get it marked in seconds against the mark scheme, point by point, with the Study Helper on hand if you get stuck.

  • 36 questions
  • 1–5 marks each
  • Instant marking
  • No sign-up needed
20 questions, marked as you go

Sample questions with model answers

Here are 4 of the questions in this topic, each with a model answer, an explanation of why it earns the marks and the mark scheme an examiner would use.

Question 1

2 marks

The mean of five numbers is 8
Four of the numbers are 3, 7, 9 and 12

Work out the fifth number.

Model answer

Total of the five numbers \(= 5 \times 8 = 40\)
\(3 + 7 + 9 + 12 = 31\)
Fifth number \(= 40 - 31 = 9\)

Explanation

Mean = total ÷ number of values, so the total of the five numbers is \(5 \times 8 = 40\). Subtract the four numbers you know. Check: \((3 + 7 + 9 + 12 + 9) \div 5 = 40 \div 5 = 8\).

Mark scheme
  1. 1 mark

    M1 for \(5 \times 8\) or 40, or \(40 - (3 + 7 + 9 + 12)\)

  2. 1 mark

    A1 for 9

    correct answer with no working scores full marks
Question 2

2 marks

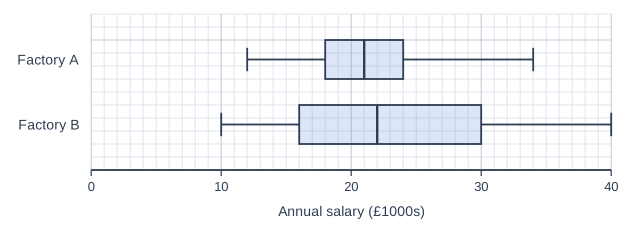
The box plots show information about the annual salaries of the 80 workers in Factory A and the 80 workers in Factory B.

Sanjay says,
"More workers in Factory B than in Factory A earn between the lower quartile and the upper quartile, because the box for Factory B is longer."

Is Sanjay correct?
Give a reason for your answer.

2 box plots, one above the other, drawn above a horizontal scale "Annual salary (£1000s)" from 0 to 40, numbered every 10, with 10 small squares between numbered values (each small square is 1), on a grid of small squares. "Factory A" (top): lowest value (left end of the left whisker) 12; lower quartile (left side of the box) 18; median (line inside the box) 21; upper quartile (right side of the box) 24; highest value (right end of the right whisker) 34. "Factory B" (bottom): lowest value (left end of the left whisker) 10; lower quartile (left side of the box) 16; median (line inside the box) 22; upper quartile (right side of the box) 30; highest value (right end of the right whisker) 40.

Model answer

No. The box always contains the middle half of the data, so in each factory 50% of 80 = 40 workers earn between the lower and upper quartiles. The longer box for Factory B only shows that those salaries are more spread out.

Explanation

A box plot splits the data into four quarters with the same number of values in each. The length of each part shows how spread out the values are, not how many values there are.

Mark scheme
  1. 1 mark

    B1 for No

  2. 1 mark

    B1dep for a correct reason, e.g. each box contains the middle 50% (half) of the workers, which is 40 workers in each factory

    oe; accept 'a longer box means the salaries are more spread out, not that there are more workers'

Question 3

3 marks

In a quiz, the mean score of 12 boys was 15
The mean score of 8 girls was 20

Work out the mean score of all 20 students.

Model answer

Total of the boys' scores: \(12 \times 15 = 180\)
Total of the girls' scores: \(8 \times 20 = 160\)
Mean of all 20 students: \((180 + 160) \div 20 = 340 \div 20 = 17\)

Explanation

You cannot just find the mean of 15 and 20, because the groups are different sizes. Work out each group's total score, add them, and divide by the total number of students.

Mark scheme
  1. 1 mark

    M1 for \(12 \times 15\) or 180, or \(8 \times 20\) or 160

  2. 1 mark

    M1dep for \((180 + 160) \div 20\)

    oe

  3. 1 mark

    A1 for 17

    correct answer with no working scores full marks; SC1 for 17.5 (from \((15 + 20) \div 2\)) only if no other marks are awarded

Question 4

4 marks

The mean mass of 10 apples is 120 g.
Two apples with a mean mass of 105 g are removed.
Three new apples are added.
The mean mass of the 11 apples is now 120 g.

Work out the mean mass of the three new apples.

Model answer

Total mass of 10 apples: \(10 \times 120 = 1200\) g
After removing two: \(1200 - 2 \times 105 = 1200 - 210 = 990\) g
Total mass of 11 apples: \(11 \times 120 = 1320\) g
Mass of the three new apples: \(1320 - 990 = 330\) g
Mean: \(330 \div 3 = 110\) g

Explanation

Work with totals, not means: total = mean × number of items. Track the total mass as apples are removed and added, then divide the mass of the new apples by 3. Notice there are 8 apples after the two are removed, and 11 after the three are added.

Mark scheme
  1. 1 mark

    M1 for \(10 \times 120\) or 1200

  2. 1 mark

    M1 for \(\text{their } 1200 - 2 \times 105\) or 990

  3. 1 mark

    M1 for \(11 \times 120 - \text{their } 990\) or 330

  4. 1 mark

    A1 for 110 g

    correct answer with no working scores full marks

Ready to try the rest? Every answer you write is marked against the mark scheme, so you can see exactly where the marks are.

Study Helper Hints first, answers after you try

Stuck on this one? Ask for a hint and I’ll point you in the right direction, without giving the answer away. Once you’ve checked your answer, I’ll show you how the marks are awarded.