
Level:
Correct: 0
Incorrect: 0
Marks: 0/0
Exam Practice
Course:
Topics:
AQA GCSE Maths (Higher calculator) Smart practice A mixed round aimed at your weak spots
Unit 1
Number
Unit 2
Algebra
Unit 3
Ratio, proportion and rates of change
Unit 4
Geometry and measures
Unit 5
Probability
Unit 6
Statistics
Avg
score:
–
Topics
done:
0/97

Using statistics to describe a population

Practise 18 exam-style questions on Using statistics to describe a population for AQA GCSE Maths (Higher calculator). Write your answer as you would in the exam and get it marked in seconds against the mark scheme, point by point, with the Study Helper on hand if you get stuck.

  • 18 questions
  • 1–5 marks each
  • Instant marking
  • No sign-up needed
18 questions, marked as you go

Sample questions with model answers

Here are 4 of the questions in this topic, each with a model answer, an explanation of why it earns the marks and the mark scheme an examiner would use.

Question 1

2 marks

There are 1240 students at a school.

A random sample of 80 students is taken.
14 of the students in the sample are left-handed.

Work out an estimate for the number of left-handed students at the school.

Model answer

Proportion left-handed in the sample = \(\frac{14}{80} = 0.175\)
Estimate = 0.175 × 1240 = 217 students

Explanation

A random sample should be representative, so assume the same proportion of the whole school is left-handed. Multiply that proportion by the size of the population.

Mark scheme
  1. 1 mark

    M1 for \(\frac{14}{80} \times 1240\)

    oe, e.g. 1240 ÷ 80 × 14 or 0.175 × 1240

  2. 1 mark

    A1 for 217

    correct answer with no working scores full marks
Question 2

2 marks

Ali wants to find out how often adults in his town travel by bus.
He asks 50 people waiting at the bus station.

Give a reason why his sample may be biased.
Describe a better way for Ali to choose his sample.

Model answer

Everyone at a bus station is about to use a bus, so they probably travel by bus more often than adults in the town as a whole.
He should choose his sample at random from a list of all the adults in the town, such as the electoral register, so that every adult has the same chance of being chosen.

Explanation

A biased sample does not represent the whole population. Where and how a sample is taken matters more than just its size: asking 500 people at the bus station would still be biased.

Mark scheme
  1. 1 mark

    B1 for a correct reason, e.g. people at a bus station are likely to use buses more than other adults in the town

  2. 1 mark

    B1 for a correct improvement, e.g. choose adults at random from a list of everyone in the town (such as the electoral register)

    accept ask people in different places at different times, chosen at random; do not accept just "ask more people"

Question 3

3 marks

A farm produces 6000 eggs each week.
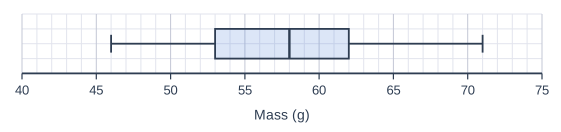
The box plot shows information about the masses, in grams, of a random sample of 100 of these eggs.

Eggs with a mass from 53 g to 62 g are sold as medium eggs for 22p each.

Work out an estimate for the weekly income from medium eggs.

A box plot drawn above a horizontal scale "Mass (g)" from 40 to 75, numbered every 5, with 5 small squares between numbered values (each small square is 1), on a grid of small squares. The box plot: lowest value (left end of the left whisker) 46; lower quartile (left side of the box) 53; median (line inside the box) 58; upper quartile (right side of the box) 62; highest value (right end of the right whisker) 71.

Model answer

53 g is the lower quartile and 62 g is the upper quartile.
Half of the eggs lie between the quartiles.
Estimated number of medium eggs = \(\frac{1}{2} \times 6000 = 3000\)
Income = 3000 × £0.22 = £660

Explanation

The box of a box plot holds the middle 50% of the data. The sample is random, so assume the same proportion of all 6000 eggs are medium. Be careful with units: 22p = £0.22.

Mark scheme
  1. 1 mark

    M1 for recognising that 53 and 62 are the quartiles, so half (50%) of the eggs are medium

  2. 1 mark

    M1dep for 0.5 × 6000 (= 3000) × 22 or 0.22

  3. 1 mark

    A1 for £660

    accept 66 000p

Question 4

4 marks

A town council wants to estimate how many of the 15 000 adults in the town would use a new leisure centre.

Kim asks a random sample of 20 adults. 7 of them say they would use it.
Leo asks a random sample of 200 adults. 54 of them say they would use it.

Whose sample should the council use? Give a reason for your answer.
Use that sample to work out an estimate for the number of adults in the town who would use the leisure centre.

Model answer

Leo's sample, because it is ten times larger, so it is likely to give a more reliable estimate.
Proportion = \(\frac{54}{200} = 0.27\)
Estimate = 0.27 × 15 000 = 4050 adults

Explanation

Both samples are random, but a larger random sample is less affected by chance, so its proportion is likely to be closer to the true proportion. Kim's sample would give \(\frac{7}{20} \times 15000 = 5250\), quite different, which shows how unreliable small samples can be.

Mark scheme
  1. 1 mark

    B1 for Leo, because his sample is larger (so more reliable)

  2. 1 mark

    M1 for \(\frac{54}{200}\) (= 0.27)

    oe, e.g. 27%

  3. 1 mark

    M1dep for their 0.27 × 15 000

    oe

  4. 1 mark

    A1 for 4050

    SC2 for 5250 from Kim's sample if no other marks

Ready to try the rest? Every answer you write is marked against the mark scheme, so you can see exactly where the marks are.

Study Helper Hints first, answers after you try

Stuck on this one? Ask for a hint and I’ll point you in the right direction, without giving the answer away. Once you’ve checked your answer, I’ll show you how the marks are awarded.