
Level:
Correct: 0
Incorrect: 0
Marks: 0/0
Exam Practice
Course:
Topics:
AQA GCSE Maths (Higher calculator) Smart practice A mixed round aimed at your weak spots
Unit 1
Number
Unit 2
Algebra
Unit 3
Ratio, proportion and rates of change
Unit 4
Geometry and measures
Unit 5
Probability
Unit 6
Statistics
Avg
score:
–
Topics
done:
0/97

Conditional probability

Practise 36 exam-style questions on Conditional probability for AQA GCSE Maths (Higher calculator). Write your answer as you would in the exam and get it marked in seconds against the mark scheme, point by point, with the Study Helper on hand if you get stuck.

  • 36 questions
  • 1–5 marks each
  • Instant marking
  • No sign-up needed
20 questions, marked as you go

Sample questions with model answers

Here are 4 of the questions in this topic, each with a model answer, an explanation of why it earns the marks and the mark scheme an examiner would use.

Question 1

2 marks

The Venn diagram shows how many of 50 students play football (F) and how many play tennis (T).

A student who plays tennis is chosen at random.
Work out the probability that this student also plays football.
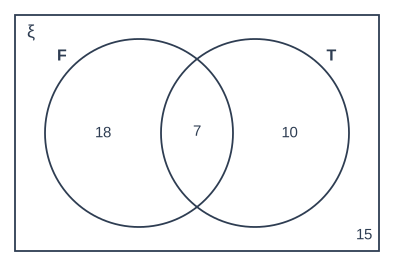
A Venn diagram: a rectangle labelled ξ (the universal set) containing two overlapping circles labelled F and T. The numbers written in each region are: F ∩ T′ (in F only): 18; F ∩ T (in both F and T): 7; F′ ∩ T (in T only): 10; F′ ∩ T′ (outside both circles): 15.

Model answer

Students who play tennis = 7 + 10 = 17
Students who play tennis and football = 7
P(plays football given plays tennis) = \(\frac{7}{17}\)

Explanation

The student is chosen from the tennis circle, which contains 7 + 10 = 17 students. Of these, 7 are in the overlap, so they also play football. A common mistake is to divide by 50 or to use only the 10 in 'tennis only' as the denominator.

Mark scheme
  1. 1 mark

    M1 for 17 as the number who play tennis, or 7 out of 17

  2. 1 mark

    A1 for \(\frac{7}{17}\)

    accept 0.41(1...); correct answer with no working scores full marks
Question 2

2 marks

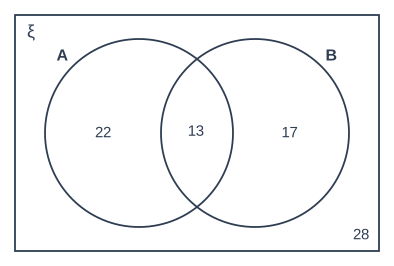
The Venn diagram shows the numbers of people in sets A and B.

A person who is not in set A is chosen at random.
Work out the probability that this person is in set B.

A Venn diagram: a rectangle labelled ξ (the universal set) containing two overlapping circles labelled A and B. The numbers written in each region are: A ∩ B′ (in A only): 22; A ∩ B (in both A and B): 13; A′ ∩ B (in B only): 17; A′ ∩ B′ (outside both circles): 28.

Model answer

People not in A = 17 (in B only) + 28 (outside both) = 45
People not in A who are in B = 17
P(in B given not in A) = \(\frac{17}{45}\)

Explanation

'Not in A' means everything outside circle A: the B-only region and the region outside both circles, 45 people. Of these, the 17 in B only are in B. A common mistake is to use n(B) = 30 as the numerator, which includes the 13 people who are in A.

Mark scheme
  1. 1 mark

    M1 for 17 + 28 (= 45) as the number not in A, or 17 out of 45

  2. 1 mark

    A1 for \(\frac{17}{45}\)

    accept 0.37(7...) or 0.378; correct answer with no working scores full marks

Question 3

3 marks

For two events A and B,
P(A) = 0.3 and P(B) = 0.48
The probability that A happens given that B happens is 0.25

Work out the probability that B happens given that A happens.

Model answer

P(A and B) = P(B) × P(A given B) = 0.48 × 0.25 = 0.12
P(B given A) = \(\frac{\text{P(A and B)}}{\text{P(A)}} = \frac{0.12}{0.3} = 0.4\)

Explanation

The probability that both happen links the two conditional probabilities: P(A and B) = P(B) × P(A given B) = P(A) × P(B given A). Find P(A and B) from the given information, then divide by P(A). In expected frequencies: of 100 trials, B happens 48 times and A happens in 12 of those; A happens 30 times altogether, and B in 12 of those.

Mark scheme
  1. 1 mark

    M1 for P(A and B) = 0.25 × 0.48 (= 0.12)

  2. 1 mark

    M1dep for their 0.12 ÷ 0.3

  3. 1 mark

    A1 for 0.4

    oe, e.g. \(\frac{2}{5}\); correct answer with no working scores full marks

Question 4

4 marks

Bag A contains 3 red balls and 2 blue balls.
Bag B contains 1 red ball and 4 blue balls.

Lily throws a fair coin.
If it lands heads, she takes a ball at random from bag A.
If it lands tails, she takes a ball at random from bag B.

The ball she takes is red.
Work out the probability that she took it from bag A.

Model answer

P(bag A and red) = 0.5 × \(\frac{3}{5}\) = 0.3
P(bag B and red) = 0.5 × \(\frac{1}{5}\) = 0.1
P(red) = 0.3 + 0.1 = 0.4
P(bag A given red) = \(\frac{0.3}{0.4} = \frac{3}{4}\)

Explanation

Draw a tree diagram: the first stage is the bag (0.5 each), the second is the colour. Given that the ball is red, only the two red paths matter, with total probability 0.4; the bag A path is 0.3 of this. In expected frequencies: in 100 goes, 50 from bag A give 30 reds and 50 from bag B give 10 reds, so 30 of the 40 reds come from bag A.

Mark scheme
  1. 1 mark

    M1 for \(0.5 \times \frac{3}{5}\) (= 0.3)

    oe

  2. 1 mark

    M1 for \(0.5 \times \frac{1}{5}\) (= 0.1)

    oe

  3. 1 mark

    M1dep for \(\frac{0.3}{0.3 + 0.1}\)

    oe, e.g. 30 out of 40 using expected frequencies

  4. 1 mark

    A1 for \(\frac{3}{4}\)

    oe, e.g. 0.75; correct answer with no working scores full marks

Ready to try the rest? Every answer you write is marked against the mark scheme, so you can see exactly where the marks are.

Study Helper Hints first, answers after you try

Stuck on this one? Ask for a hint and I’ll point you in the right direction, without giving the answer away. Once you’ve checked your answer, I’ll show you how the marks are awarded.