Level:
Correct: 0
Incorrect: 0
Marks: 0/0
Exam Practice
Course:
Topics:
AQA GCSE Maths (Higher calculator) Smart practice A mixed round aimed at your weak spots
Unit 1
Number
Unit 2
Algebra
Unit 3
Ratio, proportion and rates of change
Unit 4
Geometry and measures
Unit 5
Probability
Unit 6
Statistics
Avg
score:
–
Topics
done:
0/97

Charts, tables and diagrams

Practise 28 exam-style questions on Charts, tables and diagrams for AQA GCSE Maths (Higher calculator). Write your answer as you would in the exam and get it marked in seconds against the mark scheme, point by point, with the Study Helper on hand if you get stuck.

  • 28 questions
  • 1–5 marks each
  • Instant marking
  • No sign-up needed
20 questions, marked as you go

Sample questions with model answers

Here are 4 of the questions in this topic, each with a model answer, an explanation of why it earns the marks and the mark scheme an examiner would use.

Question 1

1 mark

The pie charts show how the students at two schools, A and B, travel to school.

Ella says,

"More students walk to school at School A than at School B, because the Walk sector for School A is bigger."

Is Ella correct?
Give a reason for your answer.
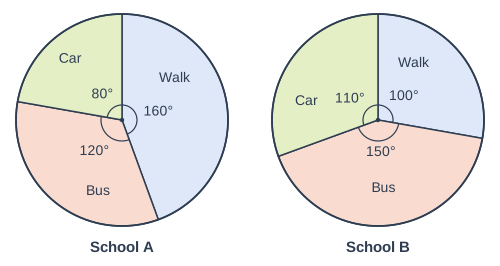
Two pie charts side by side, labelled "School A" (left) and "School B" (right). "School A": A circle divided into sectors, drawn clockwise from the top (12 o'clock): Walk, 160° (printed); Bus, 120° (printed); Car, 80° (printed). Each printed angle is marked with a small arc at the centre. "School B": A circle divided into sectors, drawn clockwise from the top (12 o'clock): Walk, 100° (printed); Bus, 150° (printed); Car, 110° (printed). Each printed angle is marked with a small arc at the centre.

Model answer

Ella is not necessarily correct. The pie charts only show the proportion of students who walk at each school. We do not know how many students are at each school, so if School B is much bigger, more students could walk there.

Explanation

A bigger sector means a bigger proportion of that school, not more students. To compare actual numbers you need the total for each pie chart. This is a common way that pie charts are misread.

Mark scheme
  1. 1 mark

    B1 for No (or 'you cannot tell'), because the pie charts show proportions, not numbers, and the numbers of students at the two schools are not known

    oe, e.g. 'School B might have more students'
Question 2

2 marks

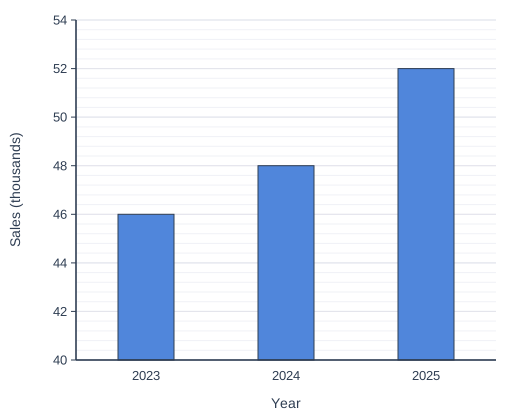
A company uses the bar chart to show its sales in three years.

The company says,

"Our sales more than doubled from 2023 to 2025"

Is the company correct?
Give a reason why the bar chart is misleading.

Bar chart of sales (thousands) for each year: 2023 46, 2024 48, 2025 52. The vertical axis starts at 40, not 0.

Model answer

No. Sales went from 46 thousand to 52 thousand, an increase of 6 thousand (about 13%), not double (which would be 92 thousand).
The chart is misleading because the vertical axis starts at 40, not 0, so the 2025 bar looks much more than twice as tall as the 2023 bar.

Explanation

Always check the scale: when the vertical axis starts above 0, the heights of the bars are not in proportion to the values, so small changes look large. Here the 2025 bar is twice as tall above 40 as the 2023 bar, but the actual sales only rose by about 13%.

Mark scheme
  1. 1 mark

    B1 for No, with a correct comparison, e.g. 52 thousand is not double 46 thousand (double would be 92 thousand)

    oe, e.g. sales only increased by 6 thousand, about 13%

  2. 1 mark

    B1 for the vertical axis does not start at 0, so the bars exaggerate the differences

    oe, e.g. 'the scale starts at 40'

Question 3

3 marks

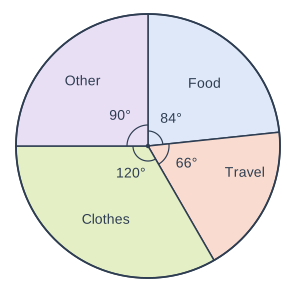
The pie chart shows how Ella spent her money last month.
She spent £42 on food.

How much more did she spend on clothes than on travel?

Pie chart. A circle divided into sectors, drawn clockwise from the top (12 o'clock): Food, 84° (printed); Travel, 66° (printed); Clothes, 120° (printed); Other, 90° (printed). Each printed angle is marked with a small arc at the centre.

Model answer

84° represents £42, so 1° represents £42 ÷ 84 = £0.50
Clothes − travel = 120° − 66° = 54°
54 × £0.50 = £27

Explanation

Use the sector you know to find what 1° is worth: £42 ÷ 84 = 50p. The difference between the clothes and travel sectors is 54°, which is worth £27. You could also find the total (£180), then clothes £60 and travel £33.

Mark scheme
  1. 1 mark

    M1 for 42 ÷ 84 (= £0.50 per degree) or a total of £180

    oe

  2. 1 mark

    M1dep for (120 − 66) × their 0.5, or their 60 − their 33

    oe

  3. 1 mark

    A1 for £27

    correct answer with no working scores full marks

Question 4

4 marks

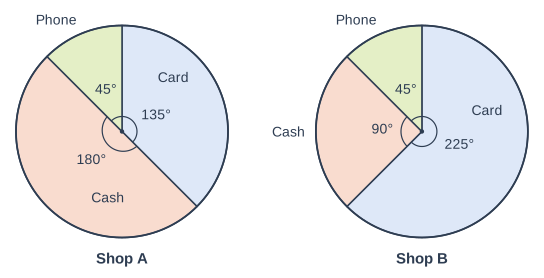
The pie charts show how customers paid in two shops, A and B, on one day.
Shop A had 400 customers.
The same number of customers paid by card in each shop.

How many more customers paid by cash in shop A than in shop B?

Two pie charts side by side, labelled "Shop A" (left) and "Shop B" (right). "Shop A": A circle divided into sectors, drawn clockwise from the top (12 o'clock): Card, 135° (printed); Cash, 180° (printed); Phone, 45° (printed). Each printed angle is marked with a small arc at the centre. "Shop B": A circle divided into sectors, drawn clockwise from the top (12 o'clock): Card, 225° (printed); Cash, 90° (printed); Phone, 45° (printed). Each printed angle is marked with a small arc at the centre.

Model answer

Shop A card: \(\frac{135}{360} \times 400 = 150\)
Shop B card is also 150, and 225° represents 150 customers
Shop B total = \(150 \div \frac{225}{360} = 240\)
Shop A cash: \(\frac{180}{360} \times 400 = 200\)
Shop B cash: \(\frac{90}{360} \times 240 = 60\)
200 − 60 = 140 more customers

Explanation

The link between the two charts is the number paying by card, which is the same in both shops. Find it from shop A, then use shop B's card angle to work out shop B's total. Only then can you change shop B's cash angle into a number of customers. Comparing angles directly (180° and 90°) does not work because the shops have different totals.

Mark scheme
  1. 1 mark

    M1 for the number paying by card in shop A: \(\frac{135}{360} \times 400\) (= 150)

    oe

  2. 1 mark

    M1dep for the total in shop B: their 150 ÷ \(\frac{225}{360}\) (= 240)

    oe, e.g. 150 ÷ 225 = \(\frac{2}{3}\) customer per degree

  3. 1 mark

    M1 for cash in shop A: \(\frac{180}{360} \times 400\) (= 200) and cash in shop B: \(\frac{90}{360} \times \text{their } 240\) (= 60)

    ft their 240

  4. 1 mark

    A1 for 140

    correct answer with no working scores full marks

Ready to try the rest? Every answer you write is marked against the mark scheme, so you can see exactly where the marks are.

Study Helper Hints first, answers after you try

Stuck on this one? Ask for a hint and I’ll point you in the right direction, without giving the answer away. Once you’ve checked your answer, I’ll show you how the marks are awarded.