
Level:
Correct: 0
Incorrect: 0
Marks: 0/0
Exam Practice
Course:
Topics:
AQA GCSE Maths (Higher calculator) Smart practice A mixed round aimed at your weak spots
Unit 1
Number
Unit 2
Algebra
Unit 3
Ratio, proportion and rates of change
Unit 4
Geometry and measures
Unit 5
Probability
Unit 6
Statistics
Avg
score:
–
Topics
done:
0/97

Real-life and non-standard graphs

Practise 29 exam-style questions on Real-life and non-standard graphs for AQA GCSE Maths (Higher calculator). Write your answer as you would in the exam and get it marked in seconds against the mark scheme, point by point, with the Study Helper on hand if you get stuck.

  • 29 questions
  • 1–5 marks each
  • Instant marking
  • No sign-up needed
20 questions, marked as you go

Sample questions with model answers

Here are 4 of the questions in this topic, each with a model answer, an explanation of why it earns the marks and the mark scheme an examiner would use.

Question 1

2 marks

The graph shows the distances of two buses from a depot during one hour.

Sam says,

"At 30 minutes Bus A was travelling faster than Bus B, because the line for Bus A is higher on the graph."

Is Sam correct?
Give a reason for your answer.
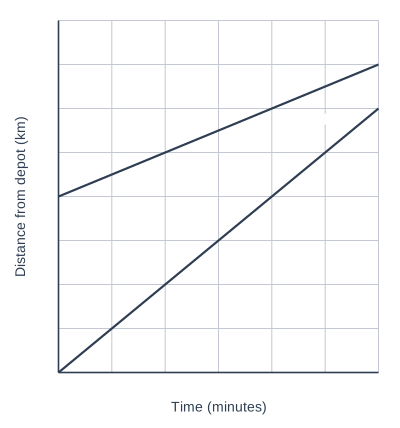
A graph of Distance from depot (km) (vertical axis, 0 to 40, marked every 5) against Time (minutes) (horizontal axis, 0 to 60, marked every 10), on a grid. The graph labelled "Bus A" is a straight line joining (0, 20) and (60, 35). The graph labelled "Bus B" is a straight line joining (0, 0) and (60, 30).

Model answer

No.
On a distance-time graph, speed is shown by how steep the line is, not how high it is.
Bus A: 35 − 20 = 15 km in 1 hour, 15 km/h
Bus B: 30 km in 1 hour, 30 km/h
Bus B was travelling faster; Bus A was just further from the depot.

Explanation

The height of a point on a distance-time graph tells you how far from the depot the bus is; the gradient tells you how fast that distance is changing. Bus A started 20 km away, so its line is higher, but Bus B's line is steeper.

Mark scheme
  1. 1 mark

    M1 for stating that speed is shown by the steepness (gradient) of the line, or for working out both speeds, e.g. Bus A 15 km/h and Bus B 30 km/h

    oe, e.g. Bus A 15 km in 60 minutes, Bus B 30 km in 60 minutes

  2. 1 mark

    A1 for No, with a correct reason, e.g. the line for Bus B is steeper, so Bus B was faster

    the higher line only shows that Bus A was further from the depot
Question 2

2 marks

A container is in the shape of a cone with its point at the bottom and its circular opening at the top.
Water is poured into the empty container at a constant rate.

Describe how the depth of the water changes over time, and describe the shape of the graph of depth against time.

Model answer

The container is narrow at the bottom and gets wider towards the top, so each litre of water raises the depth by less and less.
The depth rises quickly at first and then more slowly.
The graph is a curve starting at (0, 0) that gets less and less steep.

Explanation

With water flowing in at a constant rate, the rate the depth rises depends on the width of the container at the water surface: narrow means fast, wide means slow. A cone with its point at the bottom gets wider, so the depth-time graph is a curve that flattens out. A cylinder would give a straight line.

Mark scheme
  1. 1 mark

    B1 for the depth rising quickly at first and then more and more slowly

    oe, with or without a reason (the container gets wider)

  2. 1 mark

    B1 for a curve starting at the origin that gets less steep

    oe, e.g. a curve whose gradient decreases

Question 3

3 marks

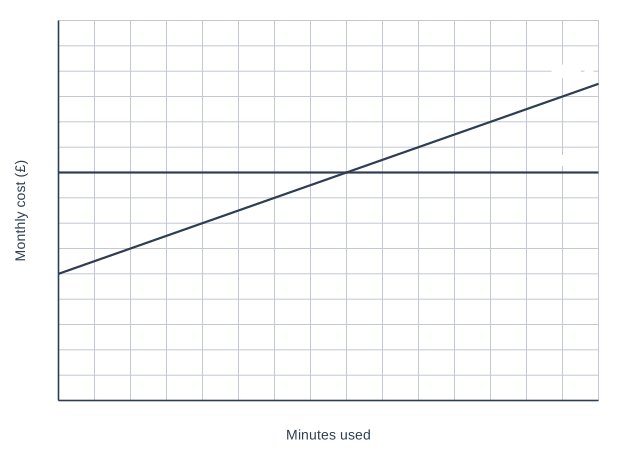
The graph shows the monthly cost of two mobile phone plans for different numbers of minutes used.

Write down the number of minutes for which the two plans cost the same.
Which plan is cheaper for 200 minutes, and by how much?

A graph of Monthly cost (£) (vertical axis, 0 to 30, marked every 2) against Minutes used (horizontal axis, 0 to 300, marked every 20), on a grid. The line labelled "Plan A" is a straight line sloping upwards from left to right crossing the y-axis at (0, 10) and passing through (80, 14). The line labelled "Plan B" is a horizontal straight line crossing the y-axis at (0, 18) (the line y = 18). The line labelled "Plan A" and the line labelled "Plan B" cross at one point, which can be read from the grid.

Model answer

The lines cross at 160 minutes, so the plans cost the same for 160 minutes.
At 200 minutes: Plan A costs £20 and Plan B costs £18
Plan B is cheaper by \(20 - 18 = 2\) pounds.

Explanation

The plans cost the same where their graphs intersect. To compare costs at 200 minutes, read up from 200 to each line. Beyond the crossing point the Plan A line is above Plan B, so Plan B is cheaper for any number of minutes greater than 160.

Mark scheme
  1. 1 mark

    B1 for 160 minutes

    accept [150, 170]

  2. 1 mark

    B1 for Plan B

  3. 1 mark

    B1 for £2

    accept [1.6, 2.4] from readings of Plan A at 200 minutes in [19.6, 20.4]

Question 4

3 marks

Taxi A charges £3.00 plus £1.60 per mile.
Taxi B charges £1.90 per mile.

Work out the length of journey for which both taxis charge the same amount.
Which taxi is cheaper for a 15-mile journey? You must show your working.

Model answer

Same cost: \(3 + 1.6d = 1.9d\)
\(3 = 0.3d\)
\(d = 10\) miles
For 15 miles: Taxi A costs \(3 + 1.6 \times 15 = 27\) pounds; Taxi B costs \(1.9 \times 15 = 28.50\) pounds
Taxi A is cheaper for a 15-mile journey.

Explanation

Each cost is a linear function of the distance; their graphs are straight lines that cross at 10 miles. Taxi B starts cheaper but increases faster (steeper line), so for journeys longer than 10 miles Taxi A is cheaper. Comparing costs needs both values worked out.

Mark scheme
  1. 1 mark

    M1 for \(3 + 1.6d = 1.9d\)

    oe, e.g. a correct graphical method, or a table of costs reaching 10 miles

  2. 1 mark

    A1 for 10 miles

  3. 1 mark

    B1 for Taxi A, with £27 and £28.50

    must have both costs

Ready to try the rest? Every answer you write is marked against the mark scheme, so you can see exactly where the marks are.

Study Helper Hints first, answers after you try

Stuck on this one? Ask for a hint and I’ll point you in the right direction, without giving the answer away. Once you’ve checked your answer, I’ll show you how the marks are awarded.