Practise 36 exam-style questions on Averages, spread and box plots for AQA GCSE Maths (Higher calculator). Write your answer as you would in the exam and get it marked in seconds against the mark scheme, point by point, with the Study Helper on hand if you get stuck.
36 questions
1–5 marks each
Instant marking
No sign-up needed
20 questions, marked as you go
Sample questions with model answers
Here are 4 of the questions in this topic, each with a model answer, an explanation of why it earns the marks and the mark scheme an examiner would use.
Question 1
2 marks
Ellie weighs the school bags of 20 students in her class. She records each mass in kilograms.
Is Ellie's data primary or secondary? Is her data discrete or continuous? Give a reason for each answer.
Model answer
Primary, because Ellie collected the data herself by weighing the bags. Continuous, because mass is measured, so it can take any value (such as 4.37 kg), not just whole numbers.
Explanation
Primary data is collected by the person using it; secondary data was collected by someone else. Measurements such as mass, length and time are continuous; counts are discrete.
Mark scheme
1 mark
B1 for primary, with a reason, e.g. Ellie collected the data herself
1 mark
B1 for continuous, with a reason, e.g. mass is measured and can take any value in a range
do not accept "it has decimals" on its own
Question 2
2 marks
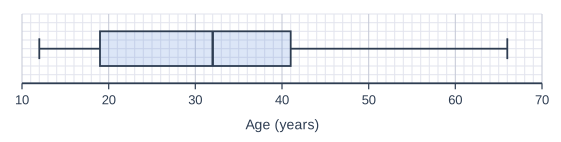
The box plot shows information about the ages, in years, of 200 people at a festival.
Work out an estimate for the number of these people aged between 19 and 32 years.
Model answer
19 is the lower quartile and 32 is the median. A quarter of the data lies between the lower quartile and the median. \(\frac{1}{4} \times 200 = 50\) people
Explanation
The quartiles and the median split the data into four equal parts, each containing about a quarter of the values. The part of the box from the lower quartile to the median holds 25% of the people, even though it is narrower than the other part of the box.
Mark scheme
1 mark
M1 for recognising that 19 is the lower quartile and 32 is the median, so a quarter of the people are in this range
or \(\frac{1}{4} \times 200\) or 25% of 200
1 mark
A1 for 50
correct answer with no working scores full marks
Question 3
3 marks
The mean of 8 numbers is 12.5
One of the numbers is removed. The mean of the other 7 numbers is 11.6
Work out the number that was removed.
Model answer
Total of the 8 numbers = 8 × 12.5 = 100 Total of the 7 numbers = 7 × 11.6 = 81.2 Number removed = 100 − 81.2 = 18.8
Explanation
Mean × number of values = total, so find both totals and subtract. Subtracting the means (12.5 − 11.6 = 0.9) is a common mistake: it ignores how many numbers there are.
Mark scheme
1 mark
M1 for 8 × 12.5 (= 100)
1 mark
M1 for 7 × 11.6 (= 81.2)
1 mark
A1 for 18.8
needs both M marks; correct answer with no working scores full marks
Question 4
4 marks
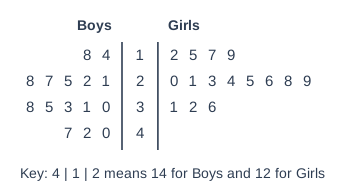
The back-to-back stem-and-leaf diagram shows the number of press-ups that 15 boys and 15 girls each did in one minute.
Compare the distributions of the number of press-ups done by the boys and the girls.
Model answer
Boys: median = 8th value = 30, lower quartile = 4th value = 22, upper quartile = 12th value = 38, interquartile range = 16 Girls: median = 24, lower quartile = 19, upper quartile = 29, interquartile range = 10 The boys' median is higher, so on average the boys did more press-ups. The girls' interquartile range is smaller, so the girls' numbers of press-ups were more consistent.
Explanation
Find the same average and the same measure of spread for both groups, then compare each in context. On the boys' side of a back-to-back diagram the leaves are read from the stem outwards, so 4 | 1 means 14.
Mark scheme
1 mark
M1 for both medians: boys 30 and girls 24
1 mark
M1 for both interquartile ranges, boys 38 − 22 = 16 and girls 29 − 19 = 10, or both ranges, boys 33 and girls 24
1 mark
B1 for a correct comparison of averages in context, e.g. the boys had a higher median so on average the boys did more press-ups
ft their medians
1 mark
B1 for a correct comparison of spread in context, e.g. the girls had a smaller interquartile range so the girls' numbers of press-ups were more consistent
ft their interquartile ranges or ranges
Ready to try the rest? Every answer you write is marked against the mark scheme, so you can see exactly where the marks are.
Ctrl + Enter to check
Study HelperHints first, answers after you try
Stuck on this one? Ask for a hint and I’ll point you in the right direction, without giving the answer away. Once you’ve checked your answer, I’ll show you how the marks are awarded.