
Level:
Correct: 0
Incorrect: 0
Marks: 0/0
Exam Practice
Course:
Topics:
AQA GCSE Maths (Higher calculator) Smart practice A mixed round aimed at your weak spots
Unit 1
Number
Unit 2
Algebra
Unit 3
Ratio, proportion and rates of change
Unit 4
Geometry and measures
Unit 5
Probability
Unit 6
Statistics
Avg
score:
–
Topics
done:
0/97

Scatter graphs and correlation

Practise 28 exam-style questions on Scatter graphs and correlation for AQA GCSE Maths (Higher calculator). Write your answer as you would in the exam and get it marked in seconds against the mark scheme, point by point, with the Study Helper on hand if you get stuck.

  • 28 questions
  • 1–5 marks each
  • Instant marking
  • No sign-up needed
20 questions, marked as you go

Sample questions with model answers

Here are 4 of the questions in this topic, each with a model answer, an explanation of why it earns the marks and the mark scheme an examiner would use.

Question 1

2 marks

The scatter graph shows the time spent revising and the test mark for each of 14 students.
One of the points, labelled A, does not fit the pattern.

Write down the coordinates of point A.
Give a possible reason why this student's result does not fit the pattern.
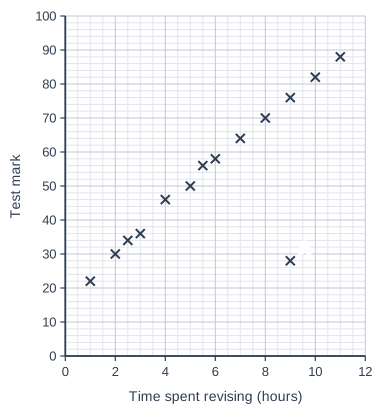
Scatter graph on a grid of small squares. The horizontal axis is "Time spent revising (hours)", from 0 to 12, numbered every 2, with 4 small squares between numbered values (each small square is 0.5). The vertical axis is "Test mark", from 0 to 100, numbered every 10, with 5 small squares between numbered values (each small square is 2). 14 points are plotted as crosses: (1, 22), (2, 30), (2.5, 34), (3, 36), (4, 46), (5, 50), (5.5, 56), (6, 58), (7, 64), (8, 70), (9, 76), (10, 82) and (11, 88), plus a point labelled A. (The labelled point's coordinates can be read from the grid.)

Model answer

A is at (9, 28): the student revised for 9 hours but scored only 28
Possible reason: the student was ill on the day of the test (or revised the wrong topics).

Explanation

An outlier is a point that does not follow the pattern of the others. The other students who revised for about 9 hours scored about 76, so 28 is far below the trend. Outliers often have a real-life explanation, or may be a recording error.

Mark scheme
  1. 1 mark

    B1 for (9, 28)

  2. 1 mark

    B1 for a sensible reason, e.g. the student was ill on the day of the test

    accept e.g. the student revised the wrong topics, or the mark was recorded wrongly
Question 2

2 marks

Jack is drawing a line of best fit on a scatter graph.

Jack says,
"A line of best fit must always pass through the origin, (0, 0)."

Is Jack correct?
Give a reason for your answer.

Model answer

No. A line of best fit is a straight line that follows the trend of the plotted points, with roughly the same number of points above and below it. It only passes through (0, 0) if the trend happens to go there; often the axes do not even start at 0

Explanation

The position of a line of best fit is decided by the data, not by the origin. Forcing it through (0, 0), or joining the first point to the last point, usually gives a line that does not fit the data.

Mark scheme
  1. 1 mark

    B1 for No

  2. 1 mark

    B1 for a correct reason, e.g. a line of best fit follows the trend of the points, with about the same number of points on each side, and need not go through (0, 0)

    accept a counter-example, e.g. the origin may not even be on the graph

Question 3

3 marks

The arm span and height of 20 adults were measured.
A line of best fit for the data passes through the points (150, 152) and (190, 191), where the first number is the arm span in cm and the second number is the height in cm.

Use the line of best fit to estimate the height of an adult with an arm span of 172 cm.
Give your answer to the nearest centimetre.

Model answer

Gradient = \(\frac{191 - 152}{190 - 150} = \frac{39}{40} = 0.975\)
172 is 22 cm more than 150
Height ≈ 152 + 0.975 × 22 = 152 + 21.45 = 173.45
Height ≈ 173 cm

Explanation

The line of best fit is a straight line, so its gradient tells you how much the height increases for each 1 cm of arm span. Start from a known point on the line and add the gradient times the change in arm span. 172 cm is inside the data, so this is a reasonable estimate.

Mark scheme
  1. 1 mark

    M1 for the gradient \(\frac{191 - 152}{190 - 150}\) (= 0.975)

    oe

  2. 1 mark

    M1dep for 152 + 0.975 × 22

    oe, e.g. using the equation \(y = 0.975x + 5.75\)

  3. 1 mark

    A1 for 173 cm

    from 173.45; do not accept 174

Question 4

4 marks

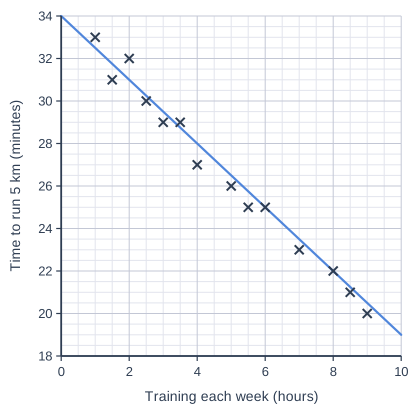
The scatter graph shows the number of hours some runners train each week and the time each runner takes to run 5 km.
A line of best fit has been drawn.

Nadia trains for 6 hours each week.
She wants to run 5 km in less than 24 minutes.

Use the line of best fit to decide whether Nadia is likely to run 5 km in less than 24 minutes.
Estimate how many more hours each week she should train to run 5 km in 24 minutes.

Scatter graph on a grid of small squares. The horizontal axis is "Training each week (hours)", from 0 to 10, numbered every 2, with 4 small squares between numbered values (each small square is 0.5). The vertical axis is "Time to run 5 km (minutes)", from 18 to 34, numbered every 2, with 4 small squares between numbered values (each small square is 0.5). 14 points are plotted as crosses: (1, 33), (1.5, 31), (2, 32), (2.5, 30), (3, 29), (3.5, 29), (4, 27), (5, 26), (5.5, 25), (6, 25), (7, 23), (8, 22), (8.5, 21) and (9, 20). A straight line of best fit is drawn; it passes through (0, 34) and (10, 19).

Model answer

At 6 hours the line gives a time of 25 minutes.
25 > 24, so Nadia is not likely to run 5 km in less than 24 minutes.
Reading across from 24 minutes to the line and down gives about 6.7 hours.
6.7 − 6 = 0.7 hours
She should train about 0.7 hours (about 40 minutes) more each week.

Explanation

Read the line both ways: up from 6 hours to find her expected time, and across from 24 minutes to find the training needed. The line drops 1.5 minutes for each extra hour, so to save 1 minute she needs about \(\frac{1}{1.5} = 0.67\) hours more. This is only an estimate: individual runners vary.

Mark scheme
  1. 1 mark

    B1 for a reading at 6 hours of 25 minutes

    accept [24.5, 25.5]

  2. 1 mark

    B1ft for not likely, as 25 minutes is more than 24 minutes

    ft their reading

  3. 1 mark

    M1 for a reading at 24 minutes in [6.4, 7]

    6.67 hours

  4. 1 mark

    A1 for about 0.7 hours (40 minutes) more

    accept [0.4, 1] hours, from their reading − 6

Ready to try the rest? Every answer you write is marked against the mark scheme, so you can see exactly where the marks are.

Study Helper Hints first, answers after you try

Stuck on this one? Ask for a hint and I’ll point you in the right direction, without giving the answer away. Once you’ve checked your answer, I’ll show you how the marks are awarded.