Level:
Correct: 0
Incorrect: 0
Marks: 0/0
Exam Practice
Course:
Topics:
AQA GCSE Maths (Higher calculator) Smart practice A mixed round aimed at your weak spots
Unit 1
Number
Unit 2
Algebra
Unit 3
Ratio, proportion and rates of change
Unit 4
Geometry and measures
Unit 5
Probability
Unit 6
Statistics
Avg
score:
–
Topics
done:
0/97

Gradient as a rate of change

Practise 28 exam-style questions on Gradient as a rate of change for AQA GCSE Maths (Higher calculator). Write your answer as you would in the exam and get it marked in seconds against the mark scheme, point by point, with the Study Helper on hand if you get stuck.

  • 28 questions
  • 1–5 marks each
  • Instant marking
  • No sign-up needed
20 questions, marked as you go

Sample questions with model answers

Here are 4 of the questions in this topic, each with a model answer, an explanation of why it earns the marks and the mark scheme an examiner would use.

Question 1

1 mark

A stone is dropped from the top of a cliff.
The graph shows the distance, d metres, it has fallen after t seconds.

Ravi says,
"The graph goes through the origin, so d is directly proportional to t."

Is Ravi correct?
Give a reason for your answer.
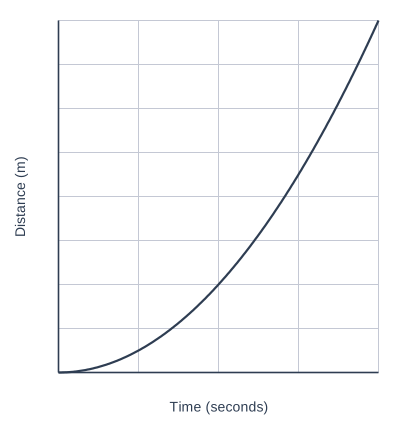
A graph of Distance (m) (vertical axis, 0 to 80, marked every 10) against Time (seconds) (horizontal axis, 0 to 4, marked every 1), on a grid. The curve is a U-shaped parabola: it touches the x-axis at (0, 0).

Model answer

No. For direct proportion the graph must be a straight line through the origin. This graph passes through the origin but it is a curve (when t doubles from 1 to 2, d goes from 5 to 20, which is 4 times as far).

Explanation

A graph shows direct proportion only when it is a straight line and passes through the origin: both conditions are needed. Here the stone speeds up, so the distance grows faster than the time and the graph curves upwards. In fact d is proportional to \(t^2\), not to t.

Mark scheme
  1. 1 mark

    B1 for No, with a correct reason, e.g. the graph is a curve, not a straight line

    oe, e.g. 'when t doubles from 1 to 2, d goes from 5 to 20, so it does not double'; do not accept 'No' with no reason or an incorrect reason
Question 2

2 marks

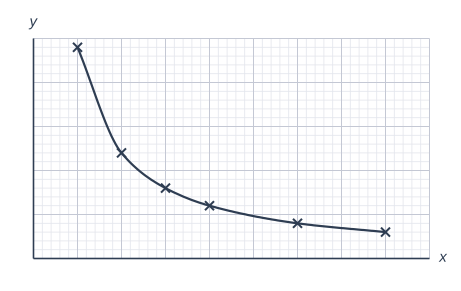
Lily writes down some pairs of values of x and y.
She plots them on the graph and joins them with a smooth curve.

Lily says,
"y is inversely proportional to x."

Is Lily correct?
Give a reason for your answer.

A coordinate grid with x from 0 to 9 and y from 0 to 25; the x-axis is marked every 1 and the y-axis every 5 (with 5 small squares along each side of a large square), and the axes cross at the origin O. The curve is a smooth curve through (1, 24), (2, 12), (3, 8), (4, 6), (6, 4) and (8, 3). A cross is marked at (1, 24). A cross is marked at (2, 12). A cross is marked at (3, 8). A cross is marked at (4, 6). A cross is marked at (6, 4). A cross is marked at (8, 3).

Model answer

The points are (1, 24), (2, 12), (3, 8), (4, 6), (6, 4) and (8, 3).
1 × 24 = 24, 2 × 12 = 24, 3 × 8 = 24, 4 × 6 = 24, 6 × 4 = 24, 8 × 3 = 24
xy = 24 for every point, so \(y = \dfrac{24}{x}\)
Yes, Lily is correct.

Explanation

If y is inversely proportional to x then \(y = \dfrac{k}{x}\), so the product xy is the same for every point. Read the points accurately and multiply each pair. A curve that slopes downwards is not enough on its own: plenty of decreasing curves are not inverse proportion.

Mark scheme
  1. 1 mark

    M1 for working out xy for at least two of the points, e.g. 1 × 24 and 3 × 8

    oe, e.g. showing that when x doubles y halves for at least one pair (2 → 4, 12 → 6)

  2. 1 mark

    A1 for Yes, with xy = 24 for every point

    oe, e.g. 'yes, because \(y = \dfrac{24}{x}\) for all the points', or doubling x halves y shown for at least two pairs

Question 3

3 marks

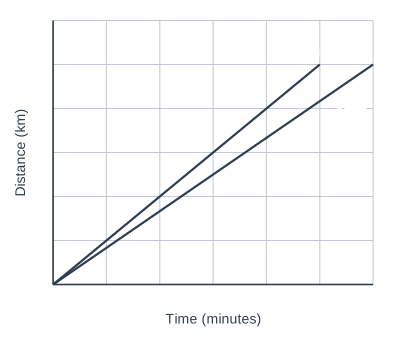
Amy and Ben each run 5 km at a constant speed.
They start at the same time.
The graph shows their distances.

Ben says,
"I ran 1.5 km/h faster than Amy."

Is Ben correct?
You must show your working.

A graph of Distance (km) (vertical axis, 0 to 6, marked every 1) against Time (minutes) (horizontal axis, 0 to 30, marked every 5), on a grid. Graph Amy is a straight line joining (0, 0) and (30, 5). Graph Ben is a straight line joining (0, 0) and (25, 5). Graph Amy and graph Ben cross at (0, 0).

Model answer

Amy: 5 km in 30 minutes = 0.5 hours, speed = \(5 \div 0.5 = 10\) km/h
Ben: 5 km in 25 minutes = \(\frac{5}{12}\) hour, speed = \(5 \div \frac{5}{12} = 12\) km/h
12 − 10 = 2 km/h
No, Ben ran 2 km/h faster than Amy, not 1.5 km/h.

Explanation

Each speed is the gradient of that runner's line, change in distance ÷ change in time. Both lines reach 5 km, Amy's at 30 minutes and Ben's at 25 minutes. Convert to km per hour before comparing; the steeper line belongs to the faster runner.

Mark scheme
  1. 1 mark

    M1 for a correct speed for Amy or Ben in consistent units, e.g. 5 ÷ 30 × 60 or 5 ÷ 25 × 60

    oe, e.g. Amy \(\frac{1}{6}\) km per minute, Ben \(\frac{1}{5}\) km per minute

  2. 1 mark

    A1 for Amy 10 km/h and Ben 12 km/h

    oe, e.g. 0.166... and 0.2 km per minute with a difference of 0.033... km per minute converted

  3. 1 mark

    A1 for No, Ben is 2 km/h faster

    must have correct values for both speeds; answer only scores 0

Question 4

4 marks

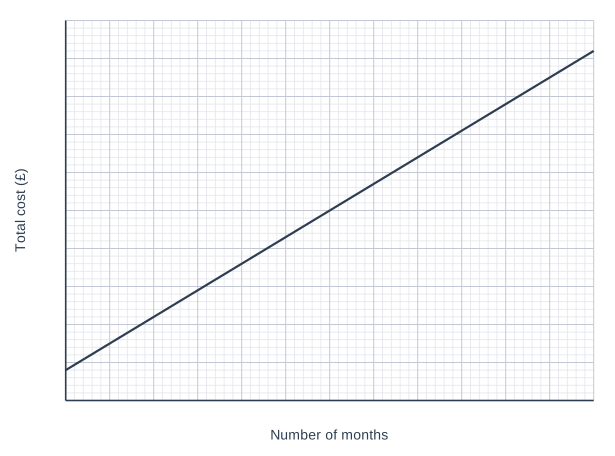
Kai is choosing between two phone plans.
The graph shows the total cost of Plan A.

Plan B costs £150 at the start and then £22 each month.

After how many whole months will the total cost of Plan B first be less than the total cost of Plan A?
You must show your working.

A graph of Total cost (£) (vertical axis, 0 to 500, marked every 50) against Number of months (horizontal axis, 0 to 12, marked every 1), on a grid with 5 small squares to each large square. The graph is a straight line joining (0, 40) and (12, 460).

Model answer

Plan A: monthly cost = \(\dfrac{460 - 40}{12} = 35\), so the total after m months is \(40 + 35m\)
Plan B: total after m months is \(150 + 22m\)
\(150 + 22m = 40 + 35m\)
\(110 = 13m\)
\(m = 8.46...\)
Check: 8 months: A = £320, B = £326; 9 months: A = £355, B = £348
Plan B is first cheaper after 9 months.

Explanation

The gradient of the graph is the monthly charge of Plan A (£35) and the starting value £40 is its upfront cost. Plan B costs more at the start but less each month, so it catches up by £13 a month: 110 ÷ 13 = 8.46..., and since the costs change only at whole months the answer is 9. Checking the totals after 8 and 9 months confirms it.

Mark scheme
  1. 1 mark

    M1 for the monthly cost of Plan A: (460 − 40) ÷ 12 (= £35)

    oe, any two correct readings from the graph

  2. 1 mark

    M1 for 40 + 35m and 150 + 22m

    oe, e.g. a table of totals for both plans for at least 2 numbers of months; ft their 35

  3. 1 mark

    M1dep for 13m = 110 or m = 8.46..., or totals for both plans after 8 and 9 months

    8 months: A £320, B £326; 9 months: A £355, B £348

  4. 1 mark

    A1 for 9 months

    do not accept 8.46 or 8 as the final answer; answer only scores 0

Ready to try the rest? Every answer you write is marked against the mark scheme, so you can see exactly where the marks are.

Study Helper Hints first, answers after you try

Stuck on this one? Ask for a hint and I’ll point you in the right direction, without giving the answer away. Once you’ve checked your answer, I’ll show you how the marks are awarded.