Level:
Correct: 0
Incorrect: 0
Marks: 0/0
Practice
Course:
Topics:
Year 7 Maths Smart practice A mixed round aimed at your weak spots
Unit 1
Place value and the number system
Unit 2
Calculating
Unit 3
Factors, multiples and powers
Unit 4
Fractions
Unit 5
Fractions, decimals and percentages
Unit 6
Algebraic expressions
Unit 7
Equations and inequalities
Unit 8
Sequences and graphs
Unit 9
Ratio and proportion
Ratio, proportion and rates of change
Writing and simplifying ratios
Quick practice5 skills
Sharing in a ratio
Quick practice5 skills
Proportion and best buys
Quick practice5 skills
Scale drawings and maps
Quick practice4 skills
Unit 10
Measures, perimeter, area and volume
Unit 11
Angles and shapes
Unit 12
Probability
Unit 13
Statistics
Avg
score:
–
Topics
done:
0/63

Types of data and frequency tables

Practise 23 questions on Types of data and frequency tables for Year 7 Maths. Tap or type your answer and find out straight away if you are right, with the Study Helper on hand if you get stuck.

  • 23 questions
  • 1–5 marks each
  • Instant marking
  • No sign-up needed
20 questions, marked as you go

Sample questions with model answers

Here are 4 of the questions in this topic, each with a model answer, an explanation of why it earns the marks and the mark scheme.

Question 1

1 mark

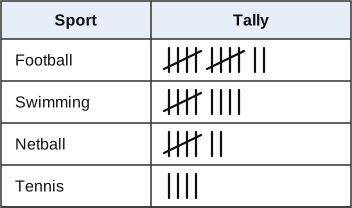
The tally chart shows the favourite sport of some pupils.

How many pupils chose swimming?

A tally chart with two columns, Sport and Tally. Football: two gates of five tally marks and 2 more marks. Swimming: one gate of five and 4 more marks. Netball: one gate of five and 2 more marks. Tennis: 4 marks.

Model answer

One gate of five and 4 more: 5 + 4 = 9

Explanation

In a tally, every fifth mark is drawn across the four before it, making a 'gate' worth 5. Swimming has one gate (5) and four single marks (4), so 5 + 4 = 9. Counting in fives first makes tallies quick to read. A common mistake is to count the line across the gate as nothing, or to count a gate as 4.

Mark scheme
  1. 1 mark

    9

    Do not accept 8 (counting the gate of five as 4).

Question 2

2 marks

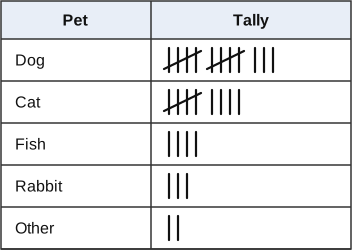
The tally chart shows the pets owned by some pupils. Each pupil chose their favourite pet.

Work out how many pupils are in the tally chart altogether.

A tally chart with two columns, Pet and Tally. Dog: two gates of five tally marks and 3 more marks. Cat: one gate of five and 4 more marks. Fish: 4 marks. Rabbit: 3 marks. Other: 2 marks.

Model answer

Dog 13, Cat 9, Fish 4, Rabbit 3, Other 2
13 + 9 + 4 + 3 + 2 = 31

Explanation

First turn each tally into a frequency, counting each gate as 5: Dog is two gates and 3 more, so 13. Then add all the frequencies to get the total number of pupils, 31. A common mistake is to count each gate as 4, because the line across it is easy to miss.

Mark scheme
  1. 1 mark

    At least four of the tallies read correctly: Dog 13, Cat 9, Fish 4, Rabbit 3, Other 2; or the correct answer 31 with no working

  2. 1 mark

    31

    A correct answer with no working scores full marks.

Question 3

2 marks

Ellie says, 'Shoe size is continuous data, because feet can be any length.'

Is Ellie right? How do you know?

Model answer

No. Foot length is continuous, but shoe sizes only come in certain values, such as 5, 5½ and 6. You cannot have a size 5.3, so shoe size is discrete.

Explanation

It is true that a foot can be any length, so foot length is continuous. But shoe size is not a length: it is chosen from a fixed list of sizes, whole and half sizes. Data that can only take separate values is discrete, even when some of the values are halves.

Mark scheme
  1. 1 mark

    No, with a relevant but incomplete reason, e.g. 'shoe size is discrete' with no reason

    'No' alone scores 0.

  2. 1 mark

    A complete correct reason: shoe sizes can only take certain values (such as 5, 5½, 6), so shoe size is discrete, even though foot length is continuous / you cannot buy a size 5.3 shoe, so shoe size is discrete

    A complete correct reason on its own scores both marks.

Question 4

4 marks

Leah wants to find out how often Year 7 pupils at her school use the school library.
She plans to ask 10 of her friends while they are in the library at lunchtime.

Which two of these are reasons why this is not a good way to collect the data?

Then which would be a good survey question for Leah, and which response boxes should she use?

Model answer

Reason 1: 10 pupils is too small a sample for the whole of Year 7.
Reason 2: Pupils who are in the library at lunchtime probably use it more than most pupils, so the results will be biased.
Question: How many times did you use the school library last week?
0 1 or 2 3 or 4 5 or more

Explanation

A good sample is big enough and is chosen so that everyone in the group has a fair chance of being asked. Asking only her friends, and only in the library, means Leah will mostly hear from people who like the library. A good survey question has a clear time period and response boxes that cover every possible answer once, so no one is left out and no one fits two boxes.

Mark scheme
  1. 1 mark

    First reason: the sample is too small / 10 pupils is not enough to represent Year 7

  2. 1 mark

    Second reason: the sample is biased, e.g. pupils who are in the library are likely to use it more than others / her friends may be alike or may not be in Year 7 / not everyone in Year 7 has a chance to be asked

    Two different reasons are needed for 2 marks. Accept them in either order.

  3. 1 mark

    A neutral question about how often pupils use the library, with a time period, e.g. 'How many times did you use the school library last week?'

    Do not accept a leading question or one with no time period ('Do you use the library a lot?').

  4. 1 mark

    Response boxes that do not overlap, have no gaps and cover every answer, e.g. 0 / 1-2 / 3-4 / 5 or more

    Boxes such as 'never, sometimes, often' score 0 for this mark, because 'sometimes' and 'often' mean different things to different people.

Ready to try the rest? Tap or type your answers and see straight away how you did.

Topic notes

Types of data and frequency tables

The big idea

Data is information you collect, such as people's favourite sports or the heights of plants. Knowing what type of data you have helps you collect it, record it and show it in the right way. A frequency table is a tidy way to record how many times each answer comes up.

Types of data

Flow chart of 6 boxes joined by arrows, read from top to bottom. The first box is "Data". From "Data", 2 arrows branch out side by side: the left arrow leads to "Categorical (words)", which leads to "e.g. eye colour, favourite food"; the right arrow leads to "Numerical (numbers)". From "Numerical (numbers)", 2 arrows branch out side by side: the left arrow leads to "Discrete: counted, e.g. number of pets"; the right arrow leads to "Continuous: measured, e.g. height".
Data is categorical or numerical, and numerical data is discrete or continuous.
  • Categorical data is words or categories, such as eye colour, favourite food or type of pet.
  • Numerical data is numbers. There are two types:
    • Discrete data is counted, so it can only take certain values, such as the number of pets (0, 1, 2 and so on) or shoe size (4, 4½, 5 and so on). You cannot have 2.7 pets.
    • Continuous data is measured, so it can take any value in a range, such as height, mass, time or temperature. A time of 12.3 seconds could be 12.34 seconds with a better stopwatch.

Collecting data

A survey collects data by asking people questions. A good survey question:

  • is clear, asks about one thing, and gives a time period if it needs one ("last week");
  • is not leading: it does not push people towards an answer ("Don't you think ...?" is leading);
  • has response boxes that do not overlap, have no gaps and cover every possible answer, such as: none, 1 to 3, 4 to 6, 7 or more.

Ask enough people, and choose them fairly. Asking only your friends, or only people in one place, gives biased results that may not be true for everyone.

Tally charts and frequency tables

A tally chart records data as you collect it: one mark for each answer, with every fifth mark drawn across the four before it to make a "gate" of five. Counting in fives is then quick. The frequency is how many times each answer comes up.

Make a frequency table of the word lengths in "Maths is fun when you learn new things every single day of the week".

Go through the words in order, tallying each length: Maths (5 letters), is (2), fun (3), when (4), and so on to week (4).

Number of lettersFrequency
22
35
42
53
62
Total14

Check: the sentence has 14 words, and \(2 + 5 + 2 + 3 + 2 = 14\).

The most common length is 3 letters. \(3 + 2 = 5\) words have more than 4 letters.

The frequencies always add up to the total. So if one frequency is missing, take the others away from the total.

Grouped frequency tables

When the data has lots of different values, it is put into groups (also called class intervals), such as 0 to 9, 10 to 19, and so on. Measured data uses inequalities: \(4 < x \le 8\) means "more than 4, and less than or equal to 8". So 8 belongs in this group, but 4 does not.

The table shows the lengths, x cm, of 25 worms. Find a, then answer the questions.

Length, x (cm)Frequency
\(0 < x \le 4\)3
\(4 < x \le 8\)a
\(8 < x \le 12\)10
\(12 < x \le 16\)3

Find a: \(25 - 3 - 10 - 3 = 9\)

How many worms are 8 cm long or shorter? A worm of exactly 8 cm is in \(4 < x \le 8\), because \(\le\) includes 8. So add the first two groups: \(3 + 9 = 12\)

How long is the longest worm? You cannot tell. It is more than 12 cm and no more than 16 cm, but a grouped table does not show exact values.

Common mistakes

  • Saying shoe size is continuous. Foot length is continuous, but shoes only come in certain sizes, so shoe size is discrete.
  • Thinking all numbers are discrete. Height, mass and time are measured, so they are continuous.
  • Response boxes that overlap (1 to 2, 2 to 3) or leave gaps (1 to 2, 4 to 5).
  • Putting a value on a boundary in the wrong group: 8 goes in \(4 < x \le 8\), not \(8 < x \le 12\).

Top tip

Cross off each piece of data as you tally it. When you finish, check that the frequencies add up to the number of pieces of data.

Study Helper Hints first, answers after you try

Stuck on this one? Ask for a hint and I’ll point you in the right direction, without giving the answer away. Once you’ve checked your answer, I’ll show you how the marks are awarded.