Level:
Correct: 0
Incorrect: 0
Marks: 0/0
Practice
Course:
Topics:
Year 7 Maths Smart practice A mixed round aimed at your weak spots
Unit 1
Place value and the number system
Unit 2
Calculating
Unit 3
Factors, multiples and powers
Unit 4
Fractions
Unit 5
Fractions, decimals and percentages
Unit 6
Algebraic expressions
Unit 7
Equations and inequalities
Unit 8
Sequences and graphs
Unit 9
Ratio and proportion
Ratio, proportion and rates of change
Writing and simplifying ratios
Quick practice5 skills
Sharing in a ratio
Quick practice5 skills
Proportion and best buys
Quick practice5 skills
Scale drawings and maps
Quick practice4 skills
Unit 10
Measures, perimeter, area and volume
Unit 11
Angles and shapes
Unit 12
Probability
Unit 13
Statistics
Avg
score:
–
Topics
done:
0/63

Pie charts

Practise 22 questions on Pie charts for Year 7 Maths. Tap or type your answer and find out straight away if you are right, with the Study Helper on hand if you get stuck.

  • 22 questions
  • 1–4 marks each
  • Instant marking
  • No sign-up needed
20 questions, marked as you go

Sample questions with model answers

Here are 4 of the questions in this topic, each with a model answer, an explanation of why it earns the marks and the mark scheme.

Question 1

1 mark

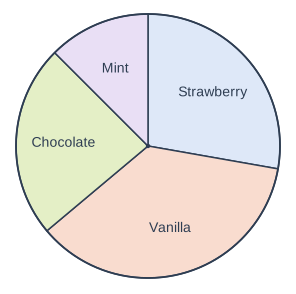
The pie chart shows the favourite ice cream flavours of some pupils.

Which flavour was the most popular?

Pie chart. A circle divided into sectors, drawn clockwise from the top (12 o'clock): Strawberry, 100°; Vanilla, 130°; Chocolate, 85°; Mint, 45°. (Angles are not printed on the chart; these are the drawn sizes, which can be measured with a protractor.)

Model answer

The biggest sector is Vanilla.
Vanilla

Explanation

In a pie chart the biggest sector shows the most popular choice, because it has the biggest angle and so stands for the most pupils. The Vanilla sector is the biggest, at \(130^\circ\).

Mark scheme
  1. 1 mark

    Vanilla

Question 2

2 marks

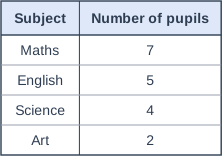
The table shows the favourite subjects of some pupils.

Ravi is drawing a pie chart of this data.

Work out the angle of the sector for Maths.

Table with columns "Subject", "Number of pupils". Subject: Maths; Number of pupils: 7 | Subject: English; Number of pupils: 5 | Subject: Science; Number of pupils: 4 | Subject: Art; Number of pupils: 2.

Model answer

Total = \(7 + 5 + 4 + 2 = 18\) pupils
Angle for one pupil = \(360 \div 18 = 20^\circ\)
Maths = \(7 \times 20 = 140^\circ\)

Explanation

Add the frequencies to find the total number of pupils, 18. Share the \(360^\circ\) between them: each pupil gets \(20^\circ\). Seven pupils chose Maths, so its sector is \(7 \times 20 = 140^\circ\). A common mistake is to divide 360 by the number of subjects instead of the number of pupils.

Mark scheme
  1. 1 mark

    Total of 18 pupils and \(360 \div 18 = 20^\circ\) for each pupil; or the correct answer \(140^\circ\) with no working

    Also award this mark for \(\dfrac{7}{18} \times 360\).

  2. 1 mark

    \(140^\circ\)

    Accept 140. A correct answer with no working scores full marks.

Question 3

2 marks

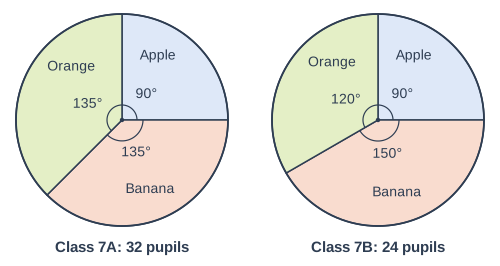
The pie charts show the favourite fruit of the pupils in Class 7A and in Class 7B. There are 32 pupils in Class 7A and 24 pupils in Class 7B.

Tom says, "The Apple sectors are the same size, so the same number of pupils chose apples in both classes."

Why is Tom wrong?

Two pie charts side by side, labelled "Class 7A: 32 pupils" (left) and "Class 7B: 24 pupils" (right). "Class 7A: 32 pupils": A circle divided into sectors, drawn clockwise from the top (12 o'clock): Apple, 90° (printed); Banana, 135° (printed); Orange, 135° (printed). Each printed angle is marked with a small arc at the centre. "Class 7B: 24 pupils": A circle divided into sectors, drawn clockwise from the top (12 o'clock): Apple, 90° (printed); Banana, 150° (printed); Orange, 120° (printed). Each printed angle is marked with a small arc at the centre.

Model answer

The Apple sectors are both \(90^\circ\), which is a quarter of each pie chart. But the classes are different sizes. A quarter of 32 is 8 and a quarter of 24 is 6, so 8 pupils chose apples in Class 7A and only 6 in Class 7B.

Explanation

A sector shows a fraction of the total, not a number. Both Apple sectors are a quarter, but a quarter of 32 pupils is 8 and a quarter of 24 pupils is 6. When two pie charts show different totals, you must work out the numbers before you compare them.

Mark scheme
  1. 1 mark

    A relevant but incomplete reason, e.g. 'the classes are different sizes' with no link to the sectors / 'the pie charts show fractions, not numbers'

  2. 1 mark

    A complete correct reason: the sectors show the same fraction (a quarter) of each class, but the classes have different numbers of pupils, so the numbers who chose apples are different (8 in Class 7A and 6 in Class 7B)

    A complete correct reason on its own scores both marks. The numbers 8 and 6 are not needed: 'the sectors are the same fraction of each class, but Class 7A has more pupils, so more pupils chose apples in 7A' scores both marks. Accept 'a quarter of 32 is 8 but a quarter of 24 is 6' for both marks. Do not accept 'the pie charts are drawn differently'.

Question 4

4 marks

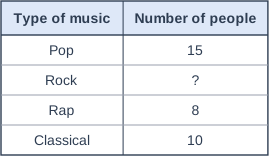
45 people were asked their favourite type of music. The table shows the results, but the number for Rock is missing.

Omar is drawing a pie chart of the results.

Work out the angle of each sector in his pie chart.

Table with columns "Type of music", "Number of people". Type of music: Pop; Number of people: 15 | Type of music: Rock; Number of people: ? | Type of music: Rap; Number of people: 8 | Type of music: Classical; Number of people: 10.

Model answer

Rock = \(45 - 15 - 8 - 10 = 12\) people
Angle for one person = \(360 \div 45 = 8^\circ\)
Pop: \(15 \times 8 = 120^\circ\)
Rock: \(12 \times 8 = 96^\circ\)
Rap: \(8 \times 8 = 64^\circ\)
Classical: \(10 \times 8 = 80^\circ\)
Check: \(120 + 96 + 64 + 80 = 360\)

Explanation

First find the missing number: the four groups add up to 45, so Rock is 12. Each person gets \(360 \div 45 = 8^\circ\), so multiply each number by 8. The angles add up to \(360^\circ\), which is a good check that they are all right.

Mark scheme
  1. 1 mark

    Number for Rock: \(45 - (15 + 8 + 10) = 12\); or all four correct angles with no working

  2. 1 mark

    Angle for one person: \(360 \div 45 = 8^\circ\)

  3. 1 mark

    At least two of the angles correct: Pop \(120^\circ\), Rock \(96^\circ\), Rap \(64^\circ\), Classical \(80^\circ\)

    Follow through for Rock from their number for Rock.

  4. 1 mark

    All four angles correct: Pop \(120^\circ\), Rock \(96^\circ\), Rap \(64^\circ\), Classical \(80^\circ\)

    Each angle must be matched to its type of music. A correct answer with no working scores full marks.

Ready to try the rest? Tap or type your answers and see straight away how you did.

Topic notes

Pie charts

The big idea

A pie chart is a circle cut into slices called sectors. Each sector shows what fraction of the whole group gave that answer: the bigger the sector, the bigger the fraction. The angles at the centre of a pie chart always add up to 360°, a full turn.

Reading a pie chart

Some angles are easy fractions of the circle:

Angle180°120°90°60°45°30°
Fraction of the pie chart\(\dfrac{1}{2}\)\(\dfrac{1}{3}\)\(\dfrac{1}{4}\)\(\dfrac{1}{6}\)\(\dfrac{1}{8}\)\(\dfrac{1}{12}\)

For any angle, the fraction is \(\dfrac{\text{angle}}{360}\). For example, 80° is \(\dfrac{80}{360} = \dfrac{2}{9}\) of the circle.

To find how many are in a sector when you know the total, either work out what 1 person (or £1) is worth in degrees, or use

\[ \text{number in a sector} = \dfrac{\text{angle}}{360} \times \text{total} \]

Ella got £24 for her birthday. The pie chart shows how she used it. How much did she spend on each thing?

Pie chart. A circle divided into sectors, drawn clockwise from the top (12 o'clock): Books, 120° (printed); Sweets, 45° (printed); Games, 150° (printed); Saved, 45° (printed). Each printed angle is marked with a small arc at the centre. (Books: frequency 8, angle 120°; Sweets: frequency 3, angle 45°; Games: frequency 10, angle 150°; Saved: frequency 3, angle 45°; total 24, so each 1 is 15°.)
How Ella used her £24 of birthday money.

Each £1 is \(360^\circ \div 24 = 15^\circ\) of the pie chart, so divide each angle by 15:

  • Books: \(120 \div 15 = 8\), so £8
  • Sweets: \(45 \div 15 = 3\), so £3
  • Games: \(150 \div 15 = 10\), so £10
  • Saved: \(45 \div 15 = 3\), so £3

Check: £8 + £3 + £10 + £3 = £24. You could also use fractions: 120° is \(\dfrac{1}{3}\) of the circle, and \(\dfrac{1}{3}\) of £24 is £8.

Working out the angles for a pie chart

  1. Find the total frequency.
  2. Work out the angle for one person: \(360^\circ \div \text{total}\).
  3. Multiply each frequency by the angle for one person.
  4. Check that the angles add up to 360°.

40 pupils chose their favourite season. Work out the angle for each sector of a pie chart.

Angle for one pupil: \(360^\circ \div 40 = 9^\circ\)

SeasonNumber of pupilsAngle
Spring6\(6 \times 9 = 54^\circ\)
Summer18\(18 \times 9 = 162^\circ\)
Autumn7\(7 \times 9 = 63^\circ\)
Winter9\(9 \times 9 = 81^\circ\)
Total40\(360^\circ\)

Check: \(54 + 162 + 63 + 81 = 360\)

To draw the pie chart, draw a circle and a line from the centre to the edge. Measure the first angle from this line with a protractor, then measure each next angle from the line you have just drawn. Label every sector.

Comparing two pie charts

A pie chart shows fractions, not numbers. When two pie charts are for groups of different sizes, a bigger sector does not always mean more people.

Town A asked 120 people and Town B asked 240 people where they like to go on holiday. Did more people choose the beach in Town A?

Two pie charts side by side, labelled "Town A: 120 people" (left) and "Town B: 240 people" (right). "Town A: 120 people": A circle divided into sectors, drawn clockwise from the top (12 o'clock): Beach, 150° (printed); City, 90° (printed); Camping, 120° (printed). Each printed angle is marked with a small arc at the centre. "Town B: 240 people": A circle divided into sectors, drawn clockwise from the top (12 o'clock): Beach, 90° (printed); City, 150° (printed); Camping, 120° (printed). Each printed angle is marked with a small arc at the centre. (Town A: 120 people: Beach: frequency 50, angle 150°; City: frequency 30, angle 90°; Camping: frequency 40, angle 120°; total 120, so each 1 is 3°. Town B: 240 people: Beach: frequency 60, angle 90°; City: frequency 100, angle 150°; Camping: frequency 80, angle 120°; total 240, so each 1 is 1.5°.)

The Beach sector is bigger for Town A (150° against 90°), but Town B asked twice as many people.

Town A: \(\dfrac{150}{360} \times 120 = 50\) people chose the beach.

Town B: 90° is \(\dfrac{1}{4}\) of the circle, and \(\dfrac{1}{4} \times 240 = 60\) people chose the beach.

So no: more people chose the beach in Town B, even though a smaller fraction of them did. The Camping sectors are the same size (120°), but they stand for 40 people in Town A and 80 people in Town B.

Common mistakes

  • Thinking a bigger sector always means more people, when the pie charts are for different totals.
  • Sharing 100 instead of 360 between the people.
  • Dividing the wrong way round: \(360 \div \text{total}\) gives the degrees for one person, not the number of people.
  • Forgetting to check that the angles add up to 360°.

Top tip

Look for easy fractions first. A 90° sector is a quarter of the circle, so it stands for a quarter of the total.

Study Helper Hints first, answers after you try

Stuck on this one? Ask for a hint and I’ll point you in the right direction, without giving the answer away. Once you’ve checked your answer, I’ll show you how the marks are awarded.