Level:
Correct: 0
Incorrect: 0
Marks: 0/0
Practice
Course:
Topics:
Year 7 Maths Smart practice A mixed round aimed at your weak spots
Unit 1
Place value and the number system
Unit 2
Calculating
Unit 3
Factors, multiples and powers
Unit 4
Fractions
Unit 5
Fractions, decimals and percentages
Unit 6
Algebraic expressions
Unit 7
Equations and inequalities
Unit 8
Sequences and graphs
Unit 9
Ratio and proportion
Ratio, proportion and rates of change
Writing and simplifying ratios
Quick practice5 skills
Sharing in a ratio
Quick practice5 skills
Proportion and best buys
Quick practice5 skills
Scale drawings and maps
Quick practice4 skills
Unit 10
Measures, perimeter, area and volume
Unit 11
Angles and shapes
Unit 12
Probability
Unit 13
Statistics
Avg
score:
–
Topics
done:
0/63

Two-way tables and frequency trees

Practise 22 questions on Two-way tables and frequency trees for Year 7 Maths. Tap or type your answer and find out straight away if you are right, with the Study Helper on hand if you get stuck.

  • 22 questions
  • 1–5 marks each
  • Instant marking
  • No sign-up needed
20 questions, marked as you go

Sample questions with model answers

Here are 4 of the questions in this topic, each with a model answer, an explanation of why it earns the marks and the mark scheme.

Question 1

1 mark

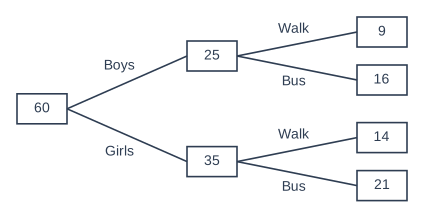
The frequency tree shows how 60 pupils travel to school.

How many girls travel by bus?

A frequency tree drawn from left to right with 2 stages of branches. It starts from a box containing 60 on the left. From the first box, branches labelled "Boys" and "Girls" lead to a box containing 25 and a box containing 35 respectively. From the "Boys" box, branches labelled "Walk" and "Bus" lead to a box containing 9 and a box containing 16 respectively. From the "Girls" box, branches labelled "Walk" and "Bus" lead to a box containing 14 and a box containing 21 respectively.

Model answer

Follow the Girls branch, then the Bus branch: 21 girls

Explanation

Read a frequency tree from left to right. Start at 60, follow the branch to Girls (35), then follow the Bus branch from there. The box at the end says 21, so 21 girls travel by bus.

Mark scheme
  1. 1 mark

    21

    Do not accept 35 (the number of girls) or 16 (the boys who travel by bus).

Question 2

2 marks

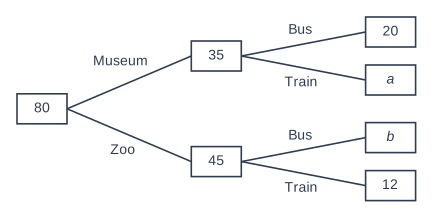
80 pupils went on a school trip. The frequency tree shows where they went and how they travelled.

Work out the values of a and b.

A frequency tree drawn from left to right with 2 stages of branches. It starts from a box containing 80 on the left. From the first box, branches labelled "Museum" and "Zoo" lead to a box containing 35 and a box containing 45 respectively. From the "Museum" box, branches labelled "Bus" and "Train" lead to a box containing 20 and a box marked a respectively. From the "Zoo" box, branches labelled "Bus" and "Train" lead to a box marked b and a box containing 12 respectively.

Model answer

\(a = 35 - 20 = 15\)
\(b = 45 - 12 = 33\)

Explanation

The 35 pupils who went to the museum split into those who went by bus and those who went by train, so \(a = 35 - 20 = 15\). In the same way the 45 who went to the zoo split into \(b\) and 12, so \(b = 45 - 12 = 33\). Each pair of boxes adds up to the box it comes from.

Mark scheme
  1. 1 mark

    \(a = 15\)

    From \(35 - 20\).

  2. 1 mark

    \(b = 33\)

    From \(45 - 12\). The values must be clearly matched to a and b. A correct answer with no working scores full marks.

Question 3

2 marks

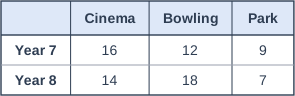
Some Year 7 and Year 8 pupils chose a place for an end-of-term trip. The two-way table shows their choices.

How many more Year 8 pupils than Year 7 pupils made a choice?

Table with columns (row headings), "Cinema", "Bowling", "Park". Year 7; Cinema: 16; Bowling: 12; Park: 9 | Year 8; Cinema: 14; Bowling: 18; Park: 7.

Model answer

Year 7: \(16 + 12 + 9 = 37\)
Year 8: \(14 + 18 + 7 = 39\)
\(39 - 37 = 2\) more Year 8 pupils

Explanation

This table has no totals, so add along each row to find how many pupils there are in each year: 37 in Year 7 and 39 in Year 8. The difference is 2. Adding a Total column to a two-way table is often a good first step.

Mark scheme
  1. 1 mark

    Both row totals: Year 7 = 37 and Year 8 = 39; or the correct answer 2 with no working

  2. 1 mark

    2

    Follow through from their two totals. A correct answer with no working scores full marks.

Question 4

4 marks

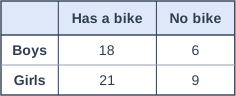
The two-way table shows whether some boys and girls have a bike.

Owen says, "In this group, a boy chosen at random is more likely to have a bike than a girl chosen at random."

How many boys and how many girls are there? What fraction of the boys and what fraction of the girls have a bike? Is Owen right?

Table with columns (row headings), "Has a bike", "No bike". Boys; Has a bike: 18; No bike: 6 | Girls; Has a bike: 21; No bike: 9.

Model answer

Boys: \(18 + 6 = 24\), so P(boy has a bike) = \(\dfrac{18}{24} = \dfrac{3}{4} = 0.75\)
Girls: \(21 + 9 = 30\), so P(girl has a bike) = \(\dfrac{21}{30} = \dfrac{7}{10} = 0.7\)
0.75 is more than 0.7, so Owen is right.

Explanation

More girls than boys have a bike (21 compared with 18), but there are more girls altogether, so you must compare fractions. \(\dfrac{18}{24} = \dfrac{3}{4} = 0.75\) and \(\dfrac{21}{30} = \dfrac{7}{10} = 0.7\). As 0.75 is more than 0.7, a boy is more likely to have a bike, so Owen is right.

Mark scheme
  1. 1 mark

    Total number of boys: \(18 + 6 = 24\)

  2. 1 mark

    Total number of girls: \(21 + 9 = 30\)

  3. 1 mark

    Both fractions or probabilities: boys \(\dfrac{18}{24}\) and girls \(\dfrac{21}{30}\)

    Accept equivalent fractions (\(\dfrac{3}{4}\) and \(\dfrac{7}{10}\)), decimals (0.75 and 0.7) or percentages (75% and 70%). Follow through from their totals.

  4. 1 mark

    Yes, because \(\dfrac{3}{4}\) (0.75) is more than \(\dfrac{7}{10}\) (0.7)

    Follow through from their fractions if compared correctly. 'Yes' alone scores 0. Do not accept 'No, because more girls have a bike' (21 compared with 18). A complete correct answer on its own, such as 'Yes: \(\dfrac{18}{24} = 0.75\) for boys and \(\dfrac{21}{30} = 0.7\) for girls', scores all 4 marks.

Ready to try the rest? Tap or type your answers and see straight away how you did.

Topic notes

Two-way tables and frequency trees

The big idea

Two-way tables and frequency trees sort one group of people (or things) in two ways at once, such as boys and girls, and how they travel to school. The parts always add up to the totals, so you can use the numbers you know to work out the ones that are missing.

Two-way tables

A two-way table has one set of categories down the side and another set across the top. Each cell shows how many belong to both its row and its column. The Total row and column give the totals, and the bottom right cell is the total for everyone.

Every row adds up to its row total, and every column adds up to its column total.

60 pupils each chose one language. 28 of the pupils are boys. 25 pupils chose French, and 10 of these are boys. 15 pupils chose German, and 6 of these are girls. The rest chose Spanish. How many girls chose Spanish?

Draw a two-way table, put in the facts you know, then fill in the gaps one at a time.

  1. Girls: \(60 - 28 = 32\)
  2. Girls who chose French: \(25 - 10 = 15\)
  3. Girls who chose Spanish: \(32 - 15 - 6 = 11\)

The rest of the table follows in the same way. Boys who chose German: \(15 - 6 = 9\). Boys who chose Spanish: \(28 - 10 - 9 = 9\). Spanish total: \(9 + 11 = 20\).

FrenchGermanSpanishTotal
Boys109928
Girls1561132
Total25152060

Check: \(25 + 15 + 20 = 60\). So 11 girls chose Spanish.

Frequency trees

A frequency tree starts with the whole group in one box. Its branches split the group into parts, and then each part is split again. The boxes at the end of a split always add up to the box they came from.

A library lent 90 books one day. 54 of them were fiction (stories) and the rest were non-fiction. Adults borrowed 30 of the fiction books. Children borrowed 15 of the non-fiction books. How many books did children borrow?

Fill in the boxes one at a time:

  • Non-fiction: \(90 - 54 = 36\)
  • Fiction borrowed by children: \(54 - 30 = 24\)
  • Non-fiction borrowed by adults: \(36 - 15 = 21\)
A frequency tree drawn from left to right with 2 stages of branches. It starts from a box containing 90 on the left. From the first box, branches labelled "Fiction" and "Non-fiction" lead to a box containing 54 and a box containing 36 respectively. From the "Fiction" box, branches labelled "Adults" and "Children" lead to a box containing 30 and a box containing 24 respectively. From the "Non-fiction" box, branches labelled "Adults" and "Children" lead to a box containing 21 and a box containing 15 respectively. (The numbers at the ends of a set of branches add up to the number in the box they split from.)
The completed frequency tree for the 90 books.

Children borrowed \(24 + 15 = 39\) books.

The same facts can go in a two-way table, with Fiction and Non-fiction across the top and Adults and Children down the side. The four end boxes of the tree are the four cells inside the table.

Common mistakes

  • Filling in a cell before you have enough information. Only fill a cell when its row (or column) has just one gap left.
  • Reading the wrong cell, such as the Spanish total (20) when the question asks about girls who chose Spanish (11).
  • Forgetting to check the totals. Every row, every column and every split in a tree must add up.
  • Using the total for everyone on the bottom of a fraction when the question is about one group only (see the stretch below).

Top tip

If the table has no Total row or column, add them yourself. Missing totals are often the key to finding the other gaps.

Stretch: fractions and probabilities

You can find fractions and probabilities straight from a two-way table or a frequency tree. The bottom of the fraction is the group you are choosing from.

  • From the language table, a pupil is chosen at random from all 60. The probability that they are a boy who chose French is \(\dfrac{10}{60} = \dfrac{1}{6}\).
  • If a girl is chosen at random, you are choosing from the 32 girls, and 11 of them chose Spanish: P(Spanish) \(= \dfrac{11}{32}\).
  • From the library tree, what fraction of the books that children borrowed were fiction? Children borrowed 39 books, and 24 of them were fiction: \(\dfrac{24}{39} = \dfrac{8}{13}\).
Study Helper Hints first, answers after you try

Stuck on this one? Ask for a hint and I’ll point you in the right direction, without giving the answer away. Once you’ve checked your answer, I’ll show you how the marks are awarded.